Research Journal for Veterinary Practitioners
Research Article
Res. J. Vet. Pract. 7(2): 39-52
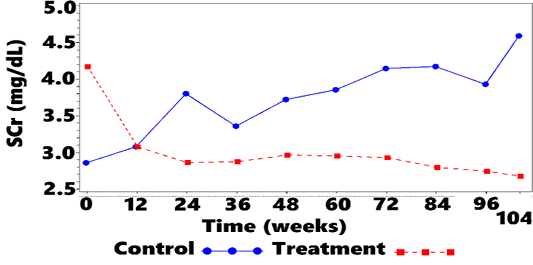
Figure 1
Mean SCra vs. Time
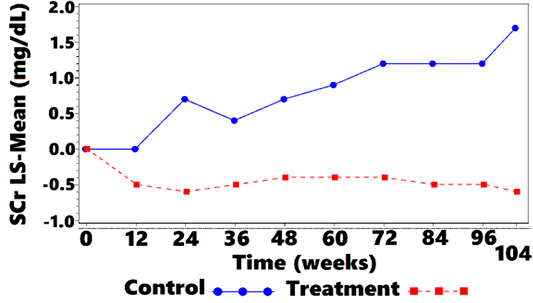
Figure 2
SCra LS-Meanb Change-from-Baseline vs. Time
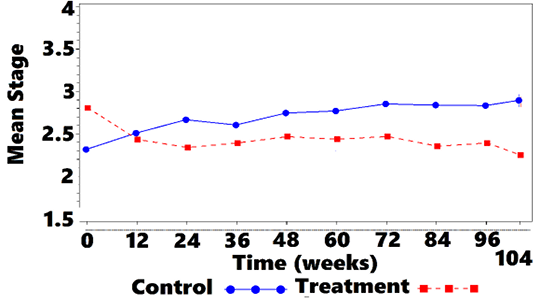
Figure 3
Mean IRISa Stage vs. Time
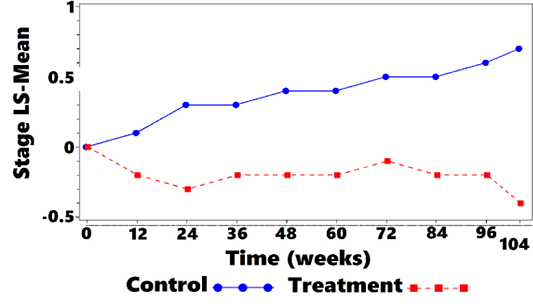
Figure 4
IRISa LS-Meanb Stage Change-from-Baseline vs. Time
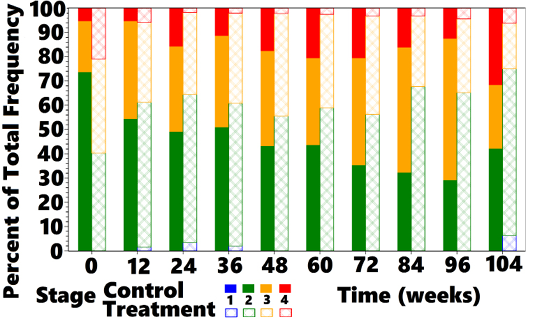
Figure 5
Cumulative IRISa Stage Frequencies in Treatment and Control Groups vs. Time
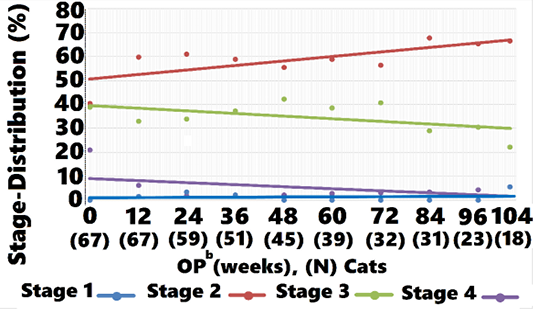
Figure 6
Treatment IRISa Stage-Distribution vs. Time
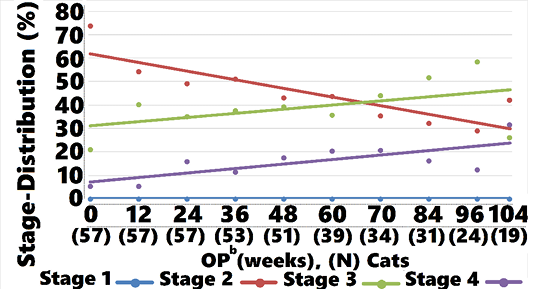
Figure 7
Control IRISa Stage-Distribution vs. Time
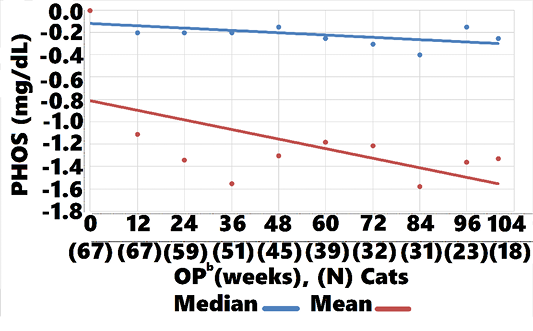
Figure 8
Treatment PHOSa Change-from-Baseline vs. Time: Median (P = 0.002), Mean (P = 0.002)
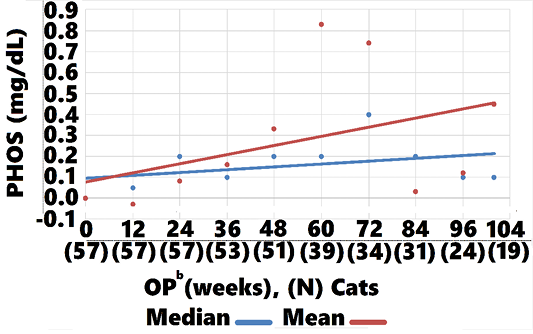
Figure 9
Control PHOSa Change-from-Baseline vs. Time: Median (P = 0.002), Mean (P = 0.004).
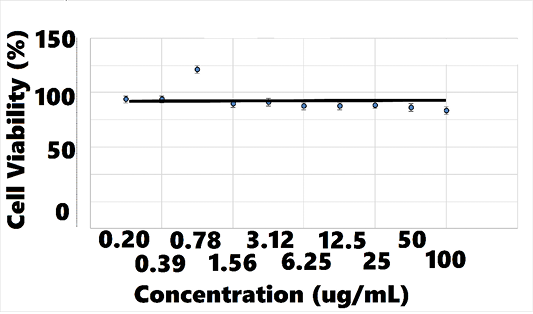
Figure 10
hRPTECa Viability vs. AB070597 Concentration
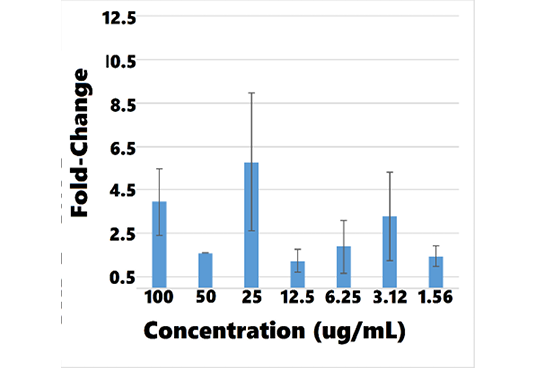
Figure 11
AB070597-Induced Fold-Change in BMP-7a mRNAb in hRPTECc, Measured by qRT-PCRd.
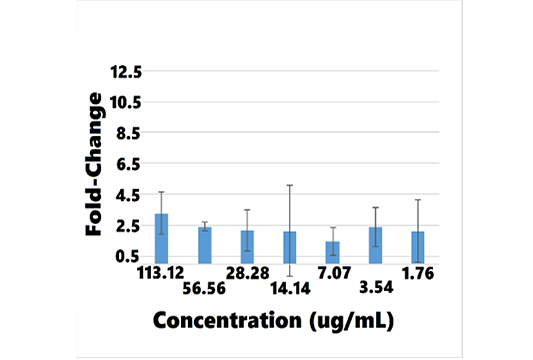
Figure 12
L-carnosine-Induced Fold-Change in BMP-7a mRNAb in hRPTECc,Measured by qRT-PCRd


