Journal of Animal Health and Production
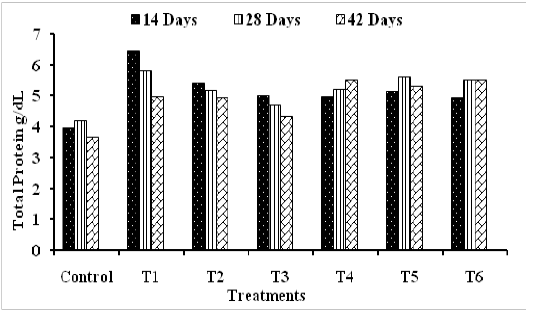
Total protein concentrations (g/dL) in serum along rearing period of broilers given probiotic strains. Each bar represents the mean for 3 birds per treatment. Chickens treated groups: T1, Lact. lactis (109cfu/mL); T2, Lact. lactis (1012cfu/mL); T3, L. plantarum (109cfu/mL); T4, L. plantarum (1012cfu/mL); T5, Lact. lactis (1012cfu/mL) plus L. plantarum (109cfu/mL); and T6, Lact. lactis (109cfu/mL) plus L. plantarum (1012cfu/mL).
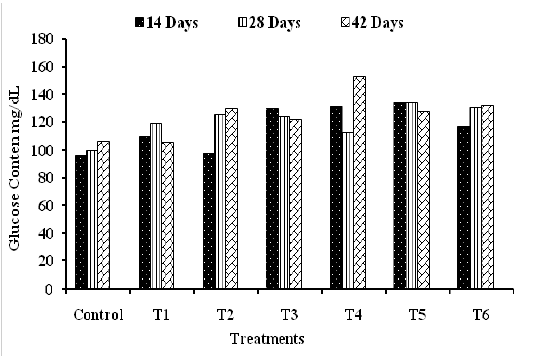
Glucose concentrations (mg/dL) in serum along rearing period of broilers given probiotic strains. Each bar represents the mean for 3 birds per treatment. Chickens treated groups: T1, Lact. lactis (109cfu/mL); T2, Lact.lactis (1012cfu/mL); T3, L. plantarum (109cfu/mL); T4, L. plantarum (1012cfu/mL); T5, Lact. lactis (1012cfu/mL) plus L. plantarum (109cfu/mL); and T6, Lact. lactis (109cfu/mL) plus L. plantarum (1012cfu/mL).


