Journal of Animal Health and Production
Research Article

Nutritional Evaluation of Selenium-methionine Nanocomposite as a Novel Dietary Supplement for Laying Hens
Taher Ahmad Salah Eldin1, Gamal Ali Abdel-Hafez Hamady2, Mamdouh Abbas Abdel-Moneim3, Khaled Yehia Farroh1, Wael Helmy Moussa El-Reffaei3
1Nanotechnology & Advanced Materials Central Lab, Agricultural Research Centre, Giza, Egypt; 2Animal Production Department, Faculty of Agriculture, Al-Azhar University, Nasr City, Cairo, Egypt; 3Regional Centre for Food and Feed, Agricultural Research Centre, Giza, Egypt.
Abstract | The auspicious potential of nanotechnology is to fabricate and adopt nanoscale approaches for nutritional problems, at the scale of ∼1–100 nm. The present study evaluates the effects of selenium-methionine nanocomposite (Nano Se-Met) levels as a novel selenium supplement compared to organic selenium-enriched yeast (SY) and sodium selenite (SS) on laying hens’ performance, egg quality, egg selenium concentrations, fatty acids and thiobarbituric acid contents of whole egg. One hundred and five Lohmann laying hens of 22 weeks old were randomly assigned to seven groups of three replicates. The control group was fed a basal diet with 0.3 mg/Kg SS and the other six groups were fed basal diet supplemented with 0.1, 0.3 and 0.5 mg/kg diet of Nano Se-Met or SY, respectively. Performance data were evaluated for 14 weeks laying period from 23 to 36 weeks of age and the end of the experimental period, egg analysis tests were performed. The results showed selenium source had insignificant effect (p>0.05) on productivity and egg quality parameters. On the other hand, the average egg weight and egg mass were increased significantly (p<0.05) with increasing dietary selenium level within each source. Also selenium concentration in albumin and yolk were increased significantly (p<0.05) for group SY (1.11 and 2.77 mg/kg respectively) followed by a decreasing order by groups fed on Nano Se-Met (0.68 and 1.44 mg/kg) and control-SS (0.0 and 0.12 mg/kg), respectively. The concentrations of selenium in albumin and yolk were significantly (p<0.05) higher for groups fed 0.5 mg/kg level of selenium within each source.
Keywords | Organic selenium, Selenium nanoparticle, Selenium-methionine nanocomposite, Laying performance
Editor | Asghar Ali Kamboh, Sindh Agriculture University, Tandojam, Pakistan.
Received | May 27, 2015; Revised | July 06, 2015; Accepted | July 08, 2015; Published | July 15, 2015
*Correspondence | Mamdouh Abbas Abdel-Moneim, Agricultural Research Centre, Giza, Egypt; Email: abbas_mamdouh@yahoo.com
Citation | Salah Eldin TA, Hamady GAA, Abdel-Moneim MA, Farroh KY, El-Reffaei WHM (2015). Nutritional evaluation of Selenium-methionine nanocomposite as a novel dietary supplement for laying hens. J. Anim. Health Prod. 3(3): 64-72.
DOI | http://dx.doi.org/10.14737/journal.jahp/2015/3.3.64.72
ISSN | 2308–2801
Copyright © 2015 Hamady et al. This is an open access article distributed under the Creative Commons Attribution License, which permits unrestricted use, distribution, and reproduction in any medium, provided the original work is properly cited.
Introduction
Selenium (Se) is an essential trace element in animal nutrition (Kim and Mahan, 2003) that exists in nature in organic and inorganic forms. It is a vital part of numerous selenoproteins, most of which are involved in the antioxidant systems of the body (Arthur, 1997; Lyons et al., 2007). The required amounts of Se for animals are ranging from 0.15 to 0.3 mg/kg depending on the animal species and the levels of vitamin E in the diet (Girling et al., 1984).
Recently, many scientific studies revealed that Se from Se-enriched yeast had higher availability in laying hens than inorganic form, resulting in higher egg Se content (Utterback et al., 2005; Skrivan et al., 2006; Pan et al., 2007). Most of previous studies on selenium supplementation of laying hens diets ranged from 0 to 1mg/kg. However, Payne et al. (2005) used Se from sodium selenite or Se-enriched yeast up to 3.0 mg/kg in the diets, without any negative effects on egg production.
Recently, nanotechnology introduced new modality in the field of broiler nutrition through the benefits of the unique properties at the nanoscale such as increasing surface area, high absorption and lower toxicity. However, there is insufficient available data about the utilization of nano compounds in laying hens. Wang (2009) found that nano-Selenium increased muscle selenium concentration in broilers than sodium selenite. Therefore, the purpose of this study was to assess the nutritional effects of Selenium-methionine (core shell) nanocomposite as a novel selenium supplement in laying hen diet on productivity, egg quality, thiobarbituric acid (TBA) contents and the egg Se-concentration compared to organic selenium-Enriched yeast and sodium selenite.
Materials and Methods
Preparation of Selenium-methionine Nanocomposite (Nano Se-Met)
Preparation and characterization of Nano Se-Met were done at Nanotechnology & Advanced Materials Central Lab, Agriculture Research Center, Giza, Egypt. Selenium-methionine (core shell) nanocomposites (60 nm) were synthesized by simultaneous reduction and conjugation preparation method proposed by Zhang et al. (2004) with some modifications. In brief, 100 ml of 1 mM Sodium Selenite heated under vigorously stirred until boiling. Only 0.2% DL- methionine was added as powder, 2 ml of 1% ascorbic acid was added drop wise until the colour change to the characteristic yellowish orange and left to cool with stirring for 30 min, then proceeds for characterization. All used chemicals were obtained from Sigma-Aldrich and used as purchased without any modification.
Nano Se-Met Characterization
UV-Vis spectrophotometer, (Cary 5000, Varian, UK) monitoring Nano Se-Met from 400 to 800 nm with a path-length of 10 mm at 12 nm/s scanning speed and 1 nm bandwidth; and High Resolution Transmission electron microscopy (HR-TEM, Tecnia, G20, 200 Kv, FEI, Netherland) was used for Nano Se-Met characterization. Sample was prepared by placing a droplet of the colloidal solution onto a carbon-coated copper grid and was allowed to dry for 45 minutes. Bright field imaging mode at electron accelerating voltage 200 kV using lanthanum hexabromide (LaB6) electron source gun was performed. Eagle CCD camera with (2k*2k) image resolution was used to acquire and collect transmitted electron images. TEM Imaging software was used. Dynamic Light Scattering (ZS-Nano, Malvern, UK) used for Nano Se-Met particle size distribution determination. For phase analysis, X-ray diffraction (XRD) patterns of Nano Se-Met were obtained using Panlytical X’pert Pro X-ray diffractometer using Cu Ka (1.54059 A°) radiation with the X-ray generatoroperating at 45 kV and 30 MA. The total Se concentration was measured by inductively coupled plasma (ICP) technique (optical emission spectrometer optima 2000 DV, Perkin Elmer).
Nano Se-Met Diet Sample
The prepared Nano Se-Met was tested for concentration determination by Inductively Coupled Plasma (ICP). Three levels, 0.1, 0.3 and 0.5 ppm, of Nano Se-Met diet samples were prepared by mixing the selected concentrations to wheat bran. Samples were mixed well for homogeny and dried at 60oC overnight. The prepared Nano Se-Met feed samples were added to the final laying hens’ diet.
Birds and Experimental Design
The experiment was performed at the poultry experimental station belonging to Animal Production Department, Faculty of Agriculture, Al-Azhar University, Cairo, Egypt. A total number of 105 Lohmann LSL laying hens of 22 weeks of age were randomly distributed into seven experimental groups with three replicates, 5 hens for each. Birds were housed individual in a battery cages, one in each cage (45-45-45cm). Average initial weight of hens at the start of experiment was ranged between 1459 to 1479 ±20g. The temperature and humidity percentages were daily measured and recorded approximately to the nearest (34±5.0oC and 52±9.0%), respectively. A photoperiod of 16L:8D was performed during the experimental period. Feeds and water were offered ad libitum throughout the experimental period. The experiment lasted for 14 weeks (up to 36 weeks of age). The conditions of housing and management of birds for all groups were similar during the experimental period and all birds were healthy and clinically free from disease. Seven experimental diets based on corn-soya were used. The first one was supplemented with 0.3 mg/Kg sodium selenite and used as a control (SS) (Lohmann LSL-Lite guide, 2011) and other groups were fed on the basal diet supplemented with 0.1, 0.3 and 0.5 mg/kg of selenium in the form of Nano Se-Met or organic selenium in the form of selenium yeast (SY). The premix used in the basal diets was free of selenium. Chemical analysis for crude protein (CP), ash, ether extracts (EE) and crud fibres (CF) of diets were carried out according to methods of AOAC (2012).
The composition of the basal diet was calculatedaccording to NRC (1994) and is given in (Table 1).
Productive Performance
Body weights were recorded at the start of the experimental period (at 22 weeks of age). Egg production, Feed Intake and average egg weight were recorded for 98 days of trial for each replicate and used to calculate weekly egg mass and feed conversion ratio. Mortality number was also recorded during the experimental period (14 weeks).
Chemical Measurements
Selenium Determination
Selenium concentrations in the experimental diets and the residual in eggs were determined according to method of AOAC (2012) using Inductivity Coupled Plasma (ICP-OES).
Fatty Acid Profile and Thiobarbituric Acid Contents (TBA) of Eggs
Egg blends were transesterified into their corresponding fatty acids methyl esters (FAMEs) using methanoleic NaOH and BF3 with methanol (Boron triflouride ) as described by AOAC (2012). The FAMEs were quantified by Shematizu Gas Chromatograph Series 2010 equipped with a 2010+Sautosampler (Japan) and interfaced with a FID. Thiobarbituric acid contents of eggs were determined according to method as described by Botsoglou et al. (1994).
Table 1: Formulation and diet composition of laying hens
|
Ingredients |
Amount (%) |
|
Ground yellow corn (8.5%CP) |
64.50 |
|
Soybean meal (44% CP) |
13.75 |
|
Corn gluten meal (60% CP) |
10.00 |
|
L-Lysine HCL % |
0.21 |
|
DL-Methionine % |
0.10 |
|
*Premix % |
0.30 |
|
Sodium chloride(NaCl) % |
0.30 |
|
Di-Calcium phosphate % |
2.14 |
|
Calcium carbonate % |
8.70 |
|
Total |
100 |
|
Calculated |
|
|
Crude protein % |
18.04 |
|
ME Kcal /Kg diet |
2838 |
|
Lysine % |
0.84 |
|
Methionine + cystein % |
0.77 |
|
Methionine % |
0.44 |
|
Available phosphorus % |
0.50 |
|
Calcium % |
3.83 |
|
Determined % |
|
|
C.P % E.E % Ash % |
18.00 4.01 4.63 |
*Each 2.5Kg of laying premix contains.Vit A 10000000 I.U – Vit D3 2000000 I.U – Vit E 10000mg – Vit K3 1000mg – Vit B11000mg –B25000mg – B61500mg –B1210000mg – Nicotinic acid 30000mg – Pantothenic acid 10000mg – folueic acid 1000mg –Biotin250mg – Choline Chloride 50% 250000mg – Fe30000– Cu4000mg –Zn 50000mg – Manganese 60000mg– Iodine 1300mg – Cobalt 100mg. Carrier Q.S up to 2.5kg
Egg Quality Traits
At the end of experiment, fresh eggs (3egg/ replicate) were taken for egg quality test. Egg shape index was calculated by dividing the wide axis by long axis of the egg (Hanafi, 1981). The two axes were measured to nearest millimetre. Eggs were weighed individually, broken at its equator and the internal contents were taken for subsequent measurements. The eggshells were washed carefully until all albumin residues were apparently discarded. Shell weight was recorded after air dried for 24 hours at 38oC. The thickness of the shell was measured at three points around the equatorial line of the egg without membrane by a micrometer to the nearest 0.01 millimetre. Shell thickness was recorded as the average of the three measurements. The yolk was separated from the albumen, and yolk and albumen were weighed separately to the nearest 0.1gm. The yolk colour was measured with the use of DSM Roche yolk colour fan.
Statistical Analysis
Data were subjected to one way analysis of variance using the General Linear Models of SPSS software program package (SPSS, 2001). Significant differences among means were separated by Duncan’s multiple range test (Duncan, 1955) at 5% level of significant.
Results and Discussion
Synthesis and Characterization of Nano Se-Met
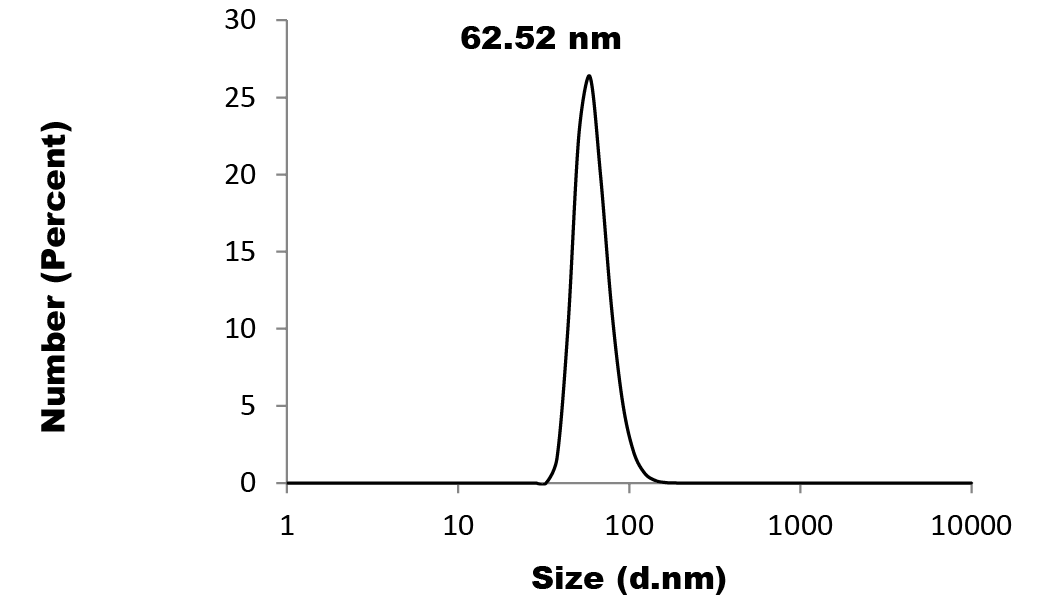
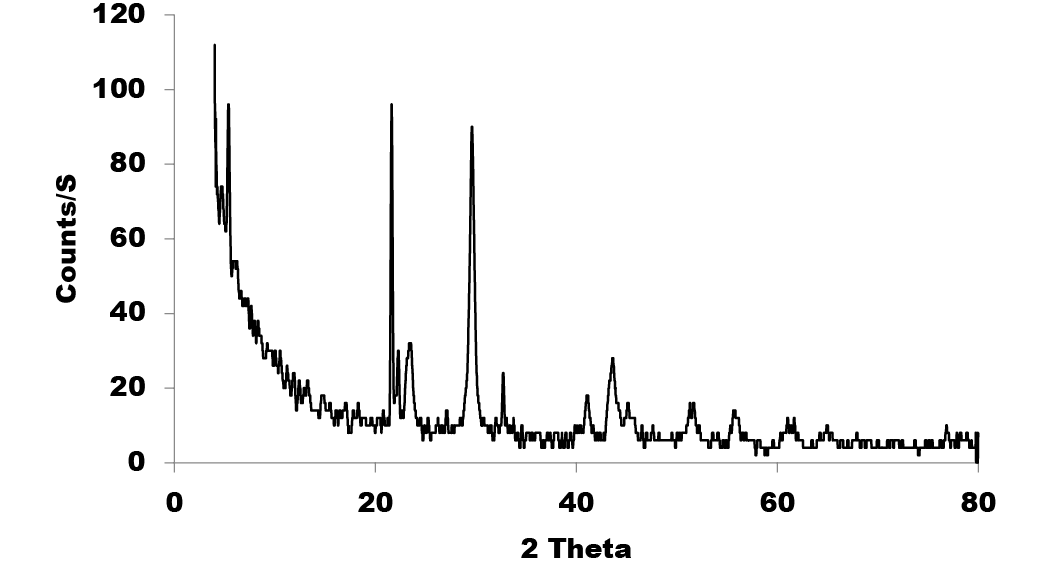
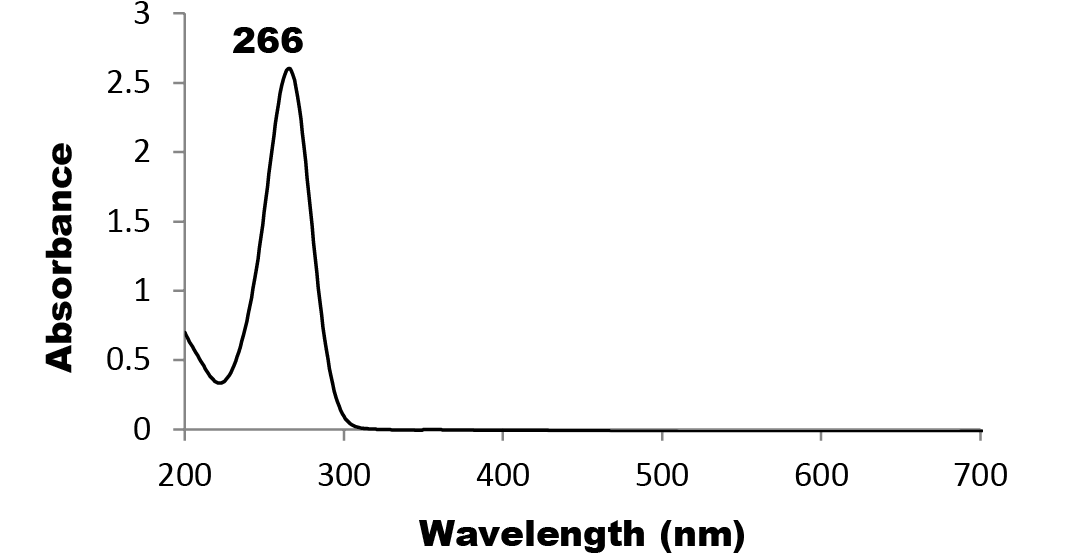
The characterization results of colloidal Nano Se-Met reveals the formation of well distributed core shell nano spheres with core average size of 60 nm and shell average size of 8 nm as it is clearly shown by the high resolution-TEM image (Figure 1). The particle size distribution of Nano Se-Met, (Figure 2) was measured by dynamic light scattering (DLS) where on the average 62 nm with perfect Poly Dispersity Index (PDI) 0.070; which confirmed the results obtained by TEM imaging and the corresponding characteristic Plasmon absorbance band at 266 nm (Figure 4). Moreover, the XRD analysis (Figure 3), were employed to investigate the phase and structure of the synthesized sample which confirm the presence of nano selenium and methionine phases. Where the broad peak at 2θ = 29.682o corresponding to the (101) reflection of selenium and the broadening suggesting that the sample in nano size in addition to that the other bands matched well with the data from the JCPDS card (1-086-2246) for Nano Se-Met (the diffraction angles at 2θ): 23.499o, 41.305o, 43.618o, 45.337o, 51.684o, and 65.197o can be assigned to (100), (110), (012), (111), (201), and (210) of the crystal planes of Nano selenium. The broad peaks at 2θ = 5.432o and 2θ = 22.193o corresponding to the (001) and (111) reflection of Methionine (JCPDS card no.00-039-1605). The characterization procedures suggest the formation of Selenium- Methionine Core-Shell nanocomposite as was proposed by this work.
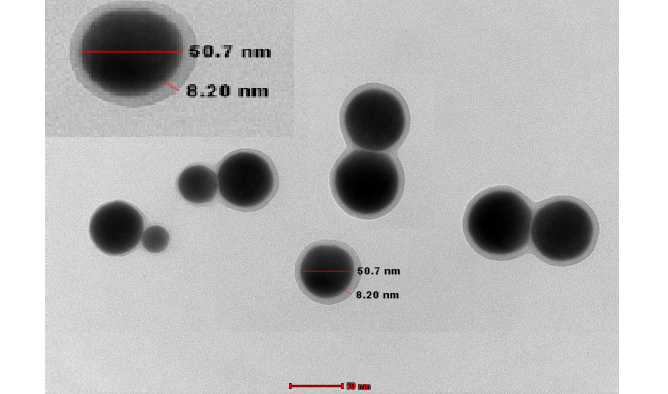
Figure 1: HR-TEM image of Nano Se-Met core shell with average size 60 nm for core and 8 nm for shell
Effect of Different Selenium Sources on Hens Performance
Table 2 shows the results of laying rate (%), average egg weight (g), egg mass (kg/bird), feed intake (kg/bird) and FCR, for 14 week laying period for groups fed different sources of selenium at 0.3 mg/kg diet. The results showed that there were no significant differences due to selenium source. These results are in agreement with some previous studies that indicated that dietary inclusion of antioxidants could not improve the performance of birds (Nghonjuyi et al., 2015). This might be due to adequacy for the experimental diets (Ensminger et al., 1990). Despite of this, there were numerical variations among measurements. The number of mortalities recorded in the present study was due to accidental factors and not to treatments.
Effect of Different Selenium Sources on Lipid Oxidation and Fatty Acids
The results presented in Table 3 revealed that thiobarbituric acid (TBA) value increased significantly (P<0.05) for groups fed SY and Nano Se-Met, compared to the control group. Concerning saturated fatty acids (SFA), results revealed that SFA increased significantly (P<0.05) for the control group (control-SS) compared to the two other selenium sources. On the other hand, insignificant differences (p>0.05) were detected among groups (Nano Se-Met and SY). Regarding the levels of unsaturated fatty acids (USFA), the results indicated significant increase in USFA levels for groups fed SY followed by a significantly (P<0.05) decreasing order for group fed Nano Se-Met and control-SS, respectively. However, conjugated linoleic acid (CLA) increased significantly (P<0.05) for group Nano Se-Met compared to SY and control-SS, whereas the differences among SY and control-SS were insignificant (p>0.05). These results indicated that SY improved nutritive value of eggs by increasing the USFA and CLA levels. As all antioxidants including selenium could exert the positive effects on animal health and performance (Kamboh et al., 2015).
Effect of Different Selenium Sources on Egg Selenium Concentrations
The results of Table 4 revealed that albumin and yolk selenium concentrations were higher significantly (P<0.05) for group SY followed by a significant decreasing order for groups fed Nano Se-Met and control-SS respectively. This result might probably be attributed to the fact that animals absorbed and retained selenium in the forms of Nano Se-Met and SY more than selenium as sodium selenite (SS).
Effect of different selenium sources on egg quality
The results indicated in Table 5 revealed that differences in egg weight, yolk weight, albumin weight, shell weight, shell thickness, yolk colour and shape index, were insignificant (P> 0.05) among all dietary treatments, however there were numerical differences between treatments. The data suggested that this might be due to adequacy for the experimental diets.
Effect of Different Levels of Nano Selenium (Nano Se-Met) Supplementation on Performance
Regardless of selenium source, the results given in Table 6 indicated that laying rate, feed intake (kg/bird) and FCR, for laying hens fed on different levels of selenium (0.1, 0.3 and 0.5 mg/kg) in form of nano-selenium was remained statistically unaffected (P> 0.05). While, the average egg weight and egg mass were significantly (P<0.05) higher for group fed 0.5 mg/kg compared to group fed 0.1 mg/kg
Table 2: Effect of different sources of selenium supplementation on performance of Lohmann laying hens from (23 to 36) weeks of age (mean ±SE)
|
Treatments |
Sig. |
|||
|
Items |
Control-SS (0.3%) |
Nano Se-Met (0.3%) |
SY (0.3%) |
|
|
Initial body weight (g)/bird (23wk) Laying rate (%)/bird Average egg weight (g)/bird Egg mass (Kg)/bird Feed intake (Kg)/bird Feed conversion ratio FCR Mortality number |
1475.65±3.48 84.86 ±1.39 54.62 ±0.29 4.54±0.07 10.17 ±0.12 2.24 ±0.05 0 |
1478.67±2.88 83.33 ±0.89 55.20 ±0.30 4.50±0.02 10.12 ±0.05 2.25 ±0.03 0 |
1471.66±2.72 83.88 ±1.22 55.33 ±0.52 4.51±0.03 10.09 ±0.07 2.23 ±0.01 1 |
N.S N.S N.S N.S N.S N.S - |
S.E: standard error; N.S: Non significant
Table 3: Effect of different sources of selenium supplementation on lipid oxidation and fatty acids of eggs (mean ±SE)
|
Treatments |
Sig. |
|||
|
Items |
Control-SS (0.3%) |
Nano Se-Met (0.3%) |
SY (0.3%) |
|
|
Thiobarbituric Acid ug/kg Saturated fatty acids (SFA) % C18:1n9 trans 12 (CLA) % Unsaturated fatty acids (USFA)% |
73.08c ±0.83 46.41a ±0.88 0.29a ±0.01 53.26c ±0.94 |
123.20b ±2.58 41.22b±0.67 0.12b±0.01 57.86b ±0.75 |
134.05a ±2.91 39.73b±0.87 0.33a±0.02 61.40a±0.35 |
* * * * |
a, b and c means the same rows have the different superscript are significantly different ( P≤0.05 ); S.E: standard error
Table 4: Effect of different sources of selenium supplementation on egg selenium concentrations (mean ±SE)
|
Treatments |
Sig. |
|||
|
Items |
Control-SS (0.3%) |
Nano Se Met (0.3%) |
SY (0.3%) |
|
|
Albumin Selenium concentration (mg/Kg) Yolk Selenium concentration (mg/Kg) |
0.00c ±0.00 0.12c ±0.01 |
0.68b ±0.0.3 1.44b ±0.06 |
1.11a ±0.07 2.77a ±0.10 |
* * |
a, b and c means the same rows have the different superscript are significantly different ( P≤0.05 ); S.E: standard error; N.S: Non significant
Table 5: Effect of different sources of selenium supplementation on egg quality (mean ±SE)
|
Treatments |
Sig. |
|||
|
Items |
Control-SS (0.3%) |
Nano Se-Met (0.3%) |
SY (0.3%) |
|
|
Egg weight (g) Yolk weight (g) Albumin weight (g) Shell weight (g) Shell thickness (mm) Yolk colour Shape index |
53.55 ±0.22 9.93 ±0.34 37.02±0.53 6.60±0.19 0.39±0.01 6.66±0.33 78.32±1.46 |
54.07 ±0.20 9.02 ±0.58 37.78±0.56 7.26±0.21 0.42±0.01 6.33±0.33 75.73±3.49 |
53.63 ±0.19 9.62 ±0.65 36.78±0.77 7.23±0.33 0.43±0.01 6.33±0.33 75.17±1.20 |
N.S N.S N.S N.S N.S N.S N.S |
S.E: standard error. N.S: Non significant
Table 6: Effect of different levels of nano selenium (Nano Se-Met) supplementation on performance of Lohmann laying hens from (23 to 36) weeks of age (mean ±SE)
|
Items |
Nano Se-Met |
Sig. |
||
|
0.1% |
0.3% |
0.5% |
||
|
Initial body weight (g)/bird (23wk) Laying rate (%)/bird Average egg weight (g)/bird Egg mass (Kg)/bird Feed intake (Kg)/bird Feed conversion ratio FCR Mortality number |
1473.43±2.72 84.60 ±1.06 53.77b ±1.14 4.45b±0.04 10.08 ±0.02 2.26 ±0.03 0 |
1478.67±2.88 83.33 ±0.90 55.20ab±0.30 4.50ab±0.03 10.22 ±0.05 2.24 ±0.02 1 |
1473.28±3.48 82.99 ±0.89 56.40a ±0.39 4.58a ±0.02 10.19 ±0.01 2.22 ±0.02 1 |
N.S N.S * * N.S N.S - |
a, b and c means the same rows have the different superscript are significantly different ( P≤0.05 ); S.E: standard error; N.S: Non significant
Table 7: Effect of different levels of nano selenium (Nano Se-Met) supplementation on lipid oxidation and fatty acids of eggs (mean ±SE)
|
|
Nano Se-Met |
Sig. |
||
|
Items |
0.1% |
0.3% |
0.5% |
|
|
Thiobarbituric Acid ug/kg Saturated fatty acids (SFA) % C18:1n9 trans 12 (CLA) % Unsaturated fatty acids (USFA)% |
69.93c ±2.91 42.82a ±1.32 0.14b ±0.02 55.35b ±0.94 |
123.20b ±2.58 41.22ab ±0.67 0.12b ±0.01 57.86b ±0.75 |
133.49a ±3.69 38.59b ±0.25 0.32a ±0.02 61.00a ±0.62 |
* * * * |
a, b and c means the same rows have the different superscript are significantly different ( P≤0.05 ); S.E: standard error; N.S: Non significant
Table 8: Effect of different levels of nano selenium (Nano Se-Met) supplementation on egg selenium concentrations mg/kg (mean ±SE)
|
Nano Se-Met |
Sig. |
|||
|
Items |
0.1% |
0.3% |
0.5% |
|
|
Albumin Selenium concentration (mg/Kg) Yolk Selenium concentration (mg/Kg) |
0.22b ±0.011 0.89c ±0.01 |
0.68a ±0.03 1.44b ±0.06 |
0.80a ±0.05 2.17a ±0.03 |
* * |
a, b and c means the same rows have the different superscript are significantly different ( P≤0.05 ); S.E: standard error; N.S: Non significant
Table 9: Effect of different levels of nano selenium (Nano Se-Met) supplementation on egg quality (mean ±SE)
|
Nano Se-Met |
Sig. |
|||
|
Items |
0.1% |
0.3% |
0.5% |
|
|
Egg weight (g) Yolk weight (g) Albumin weight (g) Shell weight (g) Shell thickness (mm) Yolk colour Shape index |
54.13 ±0.45 9.59 ±0.46 36.39±0.89 8.14±0..09 0.44±0.01 6.33±0.33 79.04±0.44 |
54.07 ±0.20 9.02 ±0.58 37.78±0.56 7.26±0.21 0.42±0.01 6.33±0.33 75.73±3.49 |
54.30 ±0.17 9.56 ±0.58 37.26±0.73 7.48±0.48 0.43±0.01 6.33±0.33 78.91±2.99 |
N.S N.S N.S N.S N.S N.S N.S |
S.E: standard error; N.S: Non significant
Table 10: Effect of different levels of organic selenium (SY) supplementation on performance of Lohmann laying hens from (23 to 36) weeks of age (mean ±SE)
|
SY |
Sig. |
|||
|
Items |
0.1% |
0.3% |
0.5% |
|
|
Initial body weight (g)/bird (23wK). Laying rate (%)/bird. Average egg weight (g)/bird. Egg mass (Kg)/bird. Feed intake (Kg)/bird. Feed conversion ratio FCR Mortality number. |
1462.86±2.72 85.03 ±1.11 53.47b ±0.75 4.45b±0.03 10.06 ±0.10 2.25a ±0.01 0 |
1471.66±2.72 83.33 ±1.22 55.33ab ±0.52 4.51ab±0.03 10.09 ±0.07 2.23ab ±0.01 1 |
1474.61±3.48 82.65 ±1.02 56.56a±0.42 4.58a±0.02 9.96 ±0.09 2.17b ±0.05 0 |
N.S N.S * * N.S * - |
a, b and c means the same rows have the different superscript are significantly different ( P≤0.05 ); S.E: standard error; N.S: Non significant
Table 11: Effect of different levels of organic selenium (SY) supplementation on lipid oxidation and fatty acids of eggs (mean ±SE)
|
Items |
Treatments |
|||
|
SY |
Sig. |
|||
|
0.1% |
0.3% |
0.5% |
||
|
Thiobarbituric Acid ug/kg Saturated fatty acids (SFA) % C18:1n9 trans 12 (CLA) % Unsaturated fatty acids (USFA)% |
94.41b ±2.26 43.31a ±1.01 0.18b ±0.02 54.26b±1.14 |
134.05a ±2.91 39.73b ±0.87 0.33a ±0.02 61.40a ±0.35 |
136.17a ±5.24 37.68b ±0.92 0.26a ±0.02 62.37a ±0.53 |
* * * * |
a, b and c means the same rows have the different superscript are significantly different ( P≤0.05 ); S.E: standard error
which recorded lowest value, however differences in these traits among groups (0.1, 0.3) and groups (0.5, 0.3) levels were insignificant (p>0.05). This result can be traced back to structure of (Nano Se-Met) which contain more methionine that leads to increased egg weight (Liu et al., 2004). Apparently, this is possible because transfer RNA cannot differentiate between Se-methionine and methionine (Gierus, 2007). The number of mortalities recorded in the present study had due to accidental factors and not to treatments.
Effect of Different Levels of Nano Selenium (Nano Se-Met) on Lipid Oxidation and Fatty Acids
The statistical evaluation of the results presented in Table 7 showed that TBA increased significantly (P<0.05) with increased nano-selenium levels from 0.1 to 0.3 and 0.5mg/kg respectively. Also, saturated fatty acids value increased significantly (P<0.05) with increasing levels of (Nano Se-Met). Concerning unsaturated fatty acids, the results revealed that USFA was higher significantly (P<0.05) for group fed 0.5mg/kg compared to groups fed 0.3 and 0.1mg/kg; whereas the differences among groups fed 0.3 and 0.1mg/kg were insignificant. Results of the same table showed that conjugated linoleic acid (CLA) increased significantly (P<0.05) for group fed 0.5mg/kg compared to groups fed 0.1 and 0.3mg/kg respectively. However, the differences among groups 0.1 and 0.3mg/kg were insignificant (p>0.05). In general, results of table7 indicted that increasing levels of selenium in form of Nano Se-Met led to the increasing TBA that further results the increasing of USFA in eggs. These results may indicated that Nano Se-Met had a very little or no effect as an antioxidant.
Effect of Different Levels of Nano Selenium (Nano Se-Met) Supplementation on Egg Selenium Concentrations
Results presented in Table 8 revealed that albumin selenium concentration was higher significantly (P<0.05) for groups fed 0.5 and 0.3 mg/kg respectively, than group fed 0.1 mg/kg. Results indicated also that, yolk selenium concentration increased significantly (P<0.05) for group fed on 0.5mg/kg followed by 0.3 and 0.1 mg/kg respectively. These results may be due to a consequence of mineral-binding lipoproteins deposited during yolk accretion (Miles, 2000).
Effect of Different Levels of Nano Selenium (Nano Se-Met) Supplementation on Egg Quality
The results of egg quality parameters in fresh eggs as affected by selenium levels were presented in Table 9. Results revealed that differences in egg weight, yolk weight, albumin weight, shell weight, shell thickness, yolk colour and shape index among all dietary treatments were insignificant (P> 0.05), however, there were numerical differences between all treatments.
Effect of Different Levels of Organic Selenium (SY) Supplementation on Performance
Concerning the effect of dietary selenium yeast (SY) levels, results presented in Table 10 showed that selenium level in form of SY had insignificant (P> 0.05) effect on laying rate and feed intake. Also, the average egg weight and egg mass were higher significantly (P< 0.05) for group fed 0.5 mg/kg. As presented in the same table FCR improved significantly (P< 0.05) with increasing levels of selenium whereas, the group fed 0.5mg/kg recorded the lower value of FCR compared to group fed 0.1 mg/kg of selenium yeast. In general, this result can be traced back to structure of selenium yeast which indicated more absorption that lead to increased egg weight. These results are in agreement with Liu et al. (2004).
Effect of Different Levels of Organic Selenium (SY) Supplementation on Lipid Oxidation and Fatty Acids
Table 11 illustrates that TBA, CLA and USFA were increased significantly (P<0.05) with increased SY levels from 0.1, 0.3 and 0.5mg/kg respectively. However differences among 0.3 and 0.5 mg/kg levels were insignificant (P> 0.05). Results of the same table showed that SFA was highest significantly (P< 0.05) for groups fed 0.1mg/kg followed by groups fed 0.3 and 0.5mg/kg however, the difference among them was insignificant (p>0.05).
Effect of Different Levels of Organic Selenium (SY) Supplementation on Egg Selenium Concentrations
The statistical evaluation of results given in the Table 12 indicated that hens fed on diet containing 0.5mg/kg selenium (SY) recorded the highest significant value for albumin selenium concentration and yolk selenium concentration of egg; followed by decreasing order by group fed 0.3(P> 0.05) and 0.1mg/kg (P< 0.05)respectively. In general results of this study indicated that use of selenium yeast in laying hens diets is very effective for increasing the selenium content of eggs. These results were agreement with Fisinin et al. (2008), Sara et al. (2008) and Hanafy et al. (2009).
Effect of Different Levels of Organic Selenium (SY) Supplementation on Egg Quality
Results of Table 13 indicated the egg quality measurements of fresh eggs that were affected by different selenium yeast (SY) levels. It revealed that differences in egg weight, yolk weight, albumin weight, shell weight, shell thickness, yolk colour and shape index among all dietary treatments were insignificant (P> 0.05), however there were numerical differences among all treatments.
Table 12: Effect of different levels of nano selenium (Nano Se-Met) supplementation on egg selenium concentrations mg/kg (mean ±SE)
|
Items |
SY |
Sig. |
||
|
0.1% |
0.3% |
0.5% |
||
|
Albumin Selenium concentration (mg/Kg) Yolk Selenium concentration (mg/Kg) |
0.27b ±0.08 0.45b ±0.12 |
1.11a ±0.07 2.77a ±0.10 |
1.25a ±0.15 2.94a ±0.10 |
* * |
a, b and c means the same rows have the different superscript are significantly different ( P≤0.05 ); S.E: standard error
Table 13: Effect of different levels of organic selenium (SY) supplementation on egg quality (mean ±SE)
|
Items |
SY |
Sig. |
||
|
0.1% |
0.3% |
0.5% |
||
|
Egg weight (g) Yolk weight (g) Albumin weight (g) Shell weight (g) Shell thickness (mm) Yolk color Shape index |
53.34 ±0.56 10.50 ±0.25 35.26±0.75 7.57±0.26 0.42±0.02 6.33±0.33 72.67±3.55 |
53.63 ±0.19 9.62 ±0.65 36.78±0.77 7.23±0.33 0.43±0.01 6.33±0.33 75.17±1.20 |
53.80 ±0.22 10.08 ±0.72 35.85±1.34 7.86±0.03 0.39±0.01 7.0±0.57 74.34±1.39 |
N.S N.S N.S N.S N.S N.S N.S |
S.E: standard error; N.S: Non significant
Conclusion
In summary it could be concluded that addition of selenium at 0.5 mg in both forms i.e., Nano Se-Met or selenium yeast could improve production traits significantly (P<0.05) and this may be due to the additional methionine levels and/or improved selenium availability. On the other hand, selenium sources had a negative effect on TBA values compared to the control group. However, among each source increasing selenium level tend to improve productively of laying hens, and these may be due to additional methionine level by the different sources. Further studies should explore the physiological aspects to specify the optimum levels of dietary inclusion.
Conflict of Interest
The authors declare no conflict of interest.
Authors contribution
All the authors contributed equally to the present work.
References


