Journal of Animal Health and Production
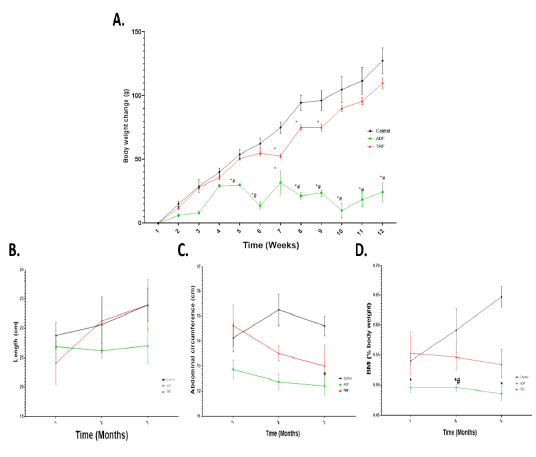
Body weight change and anthropometric measurements in different fasting protocols (ADF or TRF) for 3 months. Values are mean ± SEM. * P < 0.05 vs control. # P < 0.05 vs TRF.
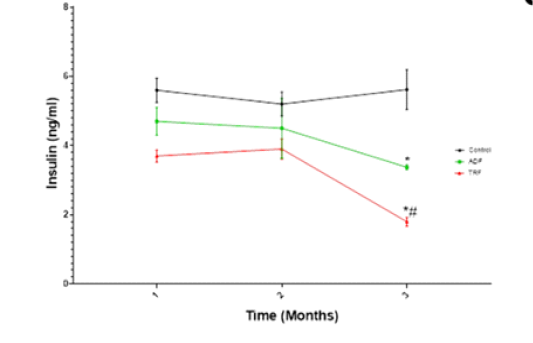
Serum insulin (ng/ml) level in different fasting protocols (ADF or TRF) for 3 months. Values are mean ± SEM. * P < 0.05 vs control. # P < 0.05 vs TRF.
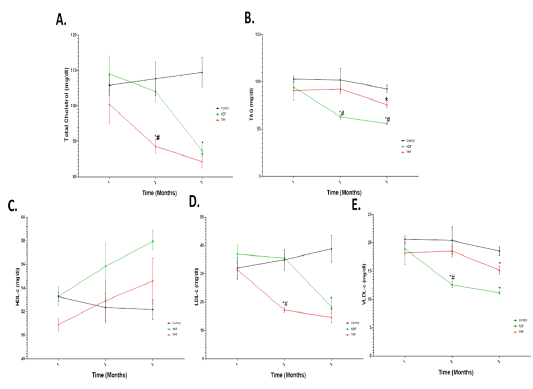
Total cholesterol (TC), Triacylglycerol (TAG), HDL-c, LDL-c and VLDL-c (mg ̸ dl) in different fasting protocols (ADF or TRF) for 3 months. Values are mean ± SEM. * P < 0.05 vs control. # P < 0.05 vs ADF.
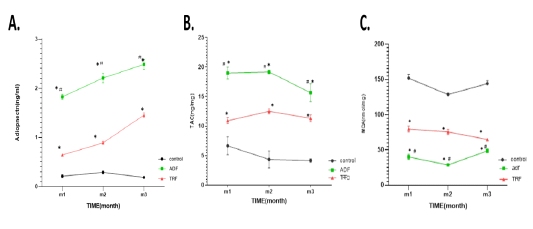
Serum adiponectin levels and hepatic TAC and MDA levels in different fasting protocols (ADF or TRF) for 3 months. Values are mean ± SEM. * P < 0.05 vs control, # P < 0.05 vs TRF, ***P<0.0001vs TRF.
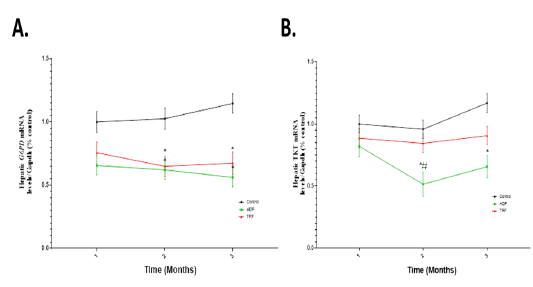
Hepatic mRNA expression levels of G6PD and TKT in different fasting protocols (ADF or TRF) for 3 months. Values are mean ± SEM. * P < 0.05 vs control. # P < 0.05 vs ADF.
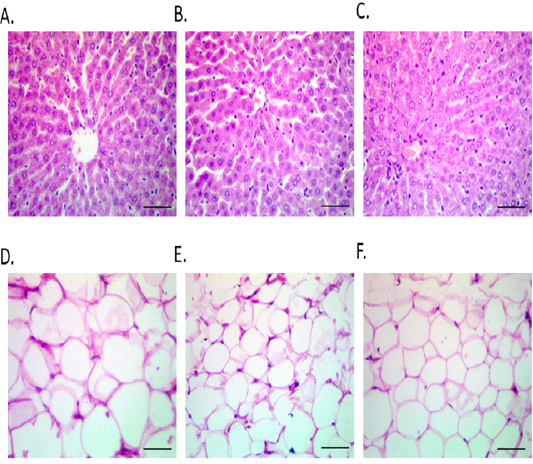
Hepatic and S/C WAT photomicrographs in different fasting protocols (ADF or TRF) for 3 months. Hepatic histological architecture of CON (Fig. 6 A), ADF (Fig. 6 B) and TRF (Fig. 6 C) groups. Subcutaneous white adipose tissue had largest diameter in CON (mean diameter=81.31mm) (Fig. 6 D), than ADF (mean diameter=30.6mm) (Fig. 6 E) and TRF groups (mean diameter=51.85mm) (Fig. 6 F).


