Journal of Animal Health and Production
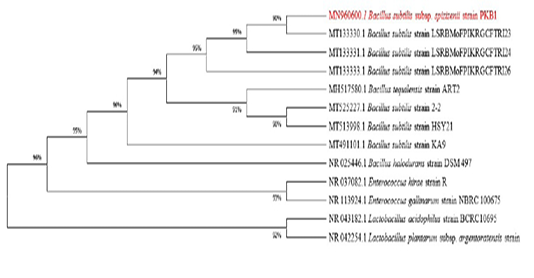
Depicts MEGA-X phylogenetic analysis of Bacillus sp. isolate. The tree with the highest log likelihood (-4108.98) is shown. Initial tree(s) for the heuristic search were obtained by applying Neighbour-Join and BioNJ algorithms to a matrix of pairwise distances estimated using the Maximum Composite Likelihood (MCL) method and then selecting the topology with superior log likelihood value. The tree was drawn to scale, with branch lengths measured in the number of substitutions per site.
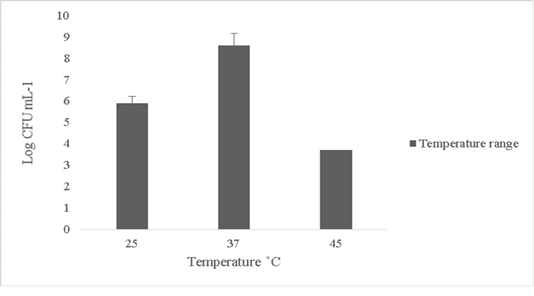
Thermal tolerance of Bacillus subtilis-MN960600 on upshifts and downshifts from 37˚C *Error bars indicate the standard deviation, the values are expressed as Mean±SD of triplicates
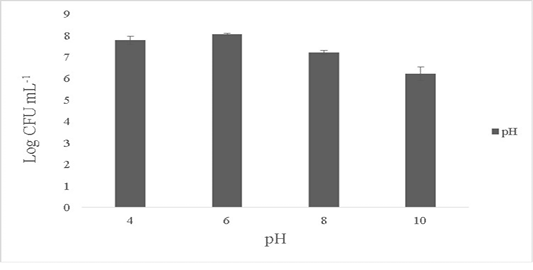
Effect of pH on the survival of the Bacillus subtilis-MN960600. *The data are means of triplicate experiments and error bars indicate standard deviations.
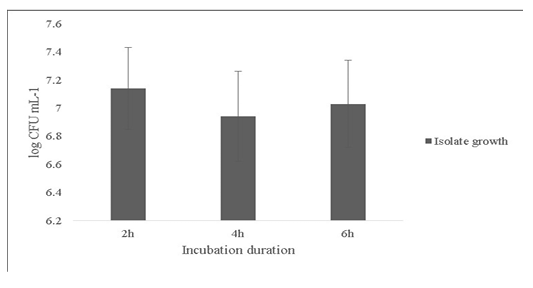
Survival of the Bacillus subtilis-MN960600 in artificial gastric juice at durations 2h, 4h and 6h. *Error bars indicate the standard deviation; the values are expressed as Mean±SD of triplicates
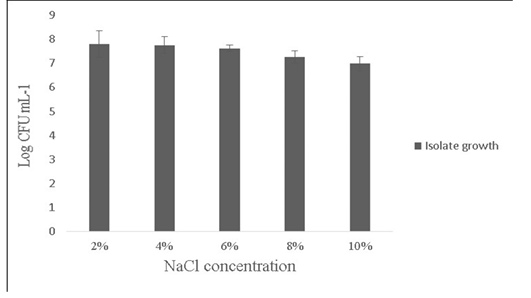
showing the effect of NaCl (2-10%) tolerance on the growth of Bacillus subtilis -MN960600. *Error bars indicate the standard deviation; the values are expressed as Mean±SD of triplicates
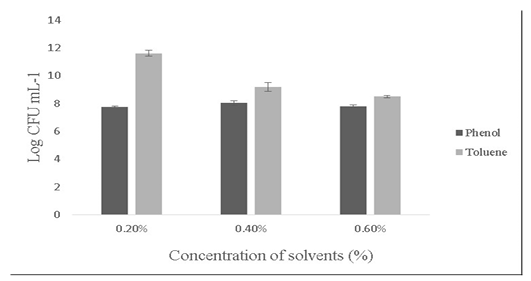
showing the effect of solvents (Phenol and toluene) on the growth of Bacillus subtilis-MN960600. *Error bars indicate the standard deviation; the values are expressed as Mean±SD of triplicates
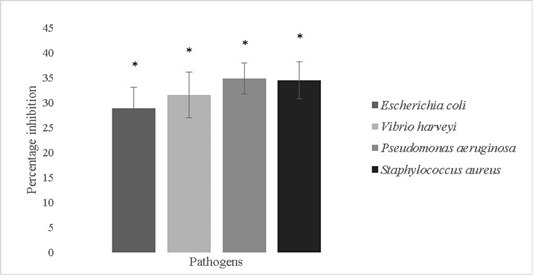
Antibiofilm activity of Bacillus subtilis-MN960600 against Escherichia coli, Vibrio harveyi, Pseudomonas aeruginosa and Staphylococcus aureus. **The error bars indicate standard deviation and statistical significance indicated by * (P<0.05)
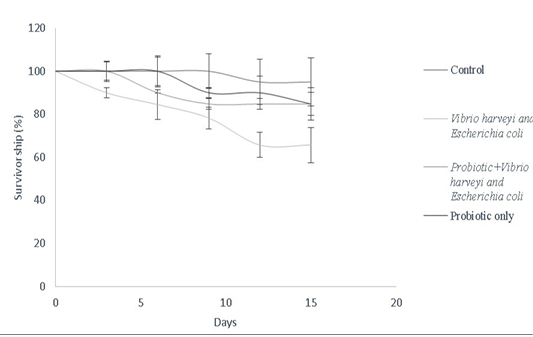
Survivorship curve of D. rerio depicting the effect of B.subtilis- MN960600 supplementation against pathogen challenge in a total duration of 15 days (Control, Vibrio harveyi and Escherichia coli, probiotic+Vibrio harveyi and Escherichia coli and probiotic only). Error bars indicate the standard deviation; the values are expressed as Mean±SD of triplicates


