Journal of Animal Health and Production
Research Article

Electrocardiographic Findings in Healthy, Hypokalemic and Hyperkalemic Dogs
Basma M. El-Said1*, Ahmed Abdelbaset-Ismail2, Abdel Raouf M. Mahmoud1, Sobhy El-Maghawry1, Shimaa M. Gouda1
1Animal Medicine Department, Faculty of Veterinary Medicine, Zagazig University, 44519 Zagazig, El-Sharkia, Egypt; 2Department of Surgery, Radiology and Anaesthesiology, Faculty of Veterinary Medicine, Zagazig University, 44519 Zagazig, El-Sharkia, Egypt.
Abstract | Changes in extracellular potassium levels affect not only the myocyte membrane potential gradients but also can alter the cardiac action potential that clinically expressed by electrocardiographic (ECG) changes. The aim of this work was therefore to describe the effect of serum potassium level changes (hyperkalemia and hypokalemia) on ECG measurements. Eighteen adult dogs were used and allocated into 3 equal groups (n=6 per each): Two hyperkalemic groups (1st and 2nd group) and one hypokalemic group (3rd group). To induce hyperkalemia, potassium chloride (KCl) solution was infused in a dose of 1000 mmol/L/hour and 3000 mmol/L/hour for 1st and 2nd group, respectively for 14 days. The 3rd group was treated with furosemide (40 mg /daily, iv) for 14 days. In all animals, ECG was performed pre- and post- medication. As noticed, in first group, the basal serum potassium (K) in the dogs remained constant as a normal without any observable ECG changes. In the second group, as expected, the level of serum K was found increased compared to control / 0 time (p<0.0001). The obtained ECG changes were an increased T-amplitude, decreased P-wave amplitude and prolonged PR interval; these changes increased progressively. In the third group, the mean of serum K level was decrease (4.17±0.15), and the features of notched and flattened T-waves, and prominent U-waves were showed in the ECG on 6th day. In conclusion, decreased P-wave amplitude and prolonged PR interval were common changes in ECG in hyperkalemia, whereas, the progression of U-wave was a common change in the ECG of hypokalemia.
Keywords | Dog, Electrocardiography, Heart; Hyperkalemia, Hypokalemia
Received | December 29, 2020; Accepted | January 19, 2021; Published | March 25, 2021
*Correspondence | Basma M El-Said, Animal Medicine Department, Faculty of Veterinary Medicine, Zagazig University, 44519 Zagazig, El-Sharkia, Egypt; Email: bmmahmoud90@gmail.com
Citation | El-Said BM, Abdelbaset-Ismail A, Mahmoud ARM, El-Maghawry S, Gouda SM (2021). Electrocardiographic findings in healthy, hypokalemic and hyperkalemic dogs . J. Anim. Health Prod. 9(s1): 20-25.
DOI | http://dx.doi.org/10.17582/journal.jahp/2021/9.s1.20.25
ISSN | 2308-2801
Copyright © 2021 Basma et al. This is an open access article distributed under the Creative Commons Attribution License, which permits unrestricted use, distribution, and reproduction in any medium, provided the original work is properly cited.
INTRODUCTION
Potassium is the most abundant intracellular ion in the body and its levels play a crucial role in normal homeostasis. The vast majority of total body potassium exists within the intracellular fluid compartment and only about 2% of it exists in the extracellular fluid (Giebisch, 1998; Bove, 2010). Almost 80% of cellular K is stored in muscle, red blood cells, liver and bones (Giebisch, 1998). Impairment of potassium homeostasis is common and can be iatrogenic, for example, caused by the use of diuretic drugs or due to diseases, e.g., chronic kidney disease (CKD), my
ocardial infarction, etc. (Ong, 2008; Nilsson et al., 2017).
Potassium ion is substantial for functionality of muscle and nerve cells like homeostasis of cell volume, resting membrane potential’s maintenance and transmission of action potentials. In cardiac and skeletal myocytes; hyperkalemia decreasing cell excitability through depolarization of the membrane (Kemel et al., 1996, DiBartola and de Morais, 2012; Sahni et al., 2013) Also it can give rise to abnormities in cardiac conduction as a sequel of its ability to change the cardiac action potential (Viera and Wouk, 2015).
Chronic kidney disease, crush injuries and some medication were considered the main causes of hyperkalemia. However the mild hyperkalemia can often be asymptomatic, the severe hyperkalemia can be a life-threatening condition and evidenced by cardiac arrhythmias, muscle weakness or muscle paralysis and death so it requires emergency treatment. Electrocardiography is the first test that should be performed in a patient with suspected hyperkalemia to early discover its lethal complication like cardiac arrhythmias (Bayes-Genis, et al., 2018; Williams and Killeen, 2019; Marti et al., 2019; Arnold et al., 2019; Simon et al., 2020).
Hypokalemia as a common electrolyte disturbance has the potential to increase the risk of arrhythmia. In general, hypokalemia is defined as a serum potassium level less than 3.5 mmol/L, whereas the potassium level became less than 3.0 mmol/L called moderate hypokalemia and when became less than 2.5 mmol/L called severe hypokalemia (Schulman and Narins, 1990; Habbab and EL-sherif, 1992; Gennari, 1998; Martinez-Vea et al., 1999; Pezhouman et al., 2015). Hypokalemia results mainly from renal losses, low potassium intake and trans-cellular shifts (El-Sherif and Turitto, 2011). Potassium level in blood decreases in some case like diarrhea, persistent vomiting and use of medications like diuretics and steroids. Potassium imbalance can lead to strenuous clinical effects particularly on the cardiovascular and neuromuscular systems (Phillips and Polzin, 1998). Hypokalemia is one of the common electrolyte disturbances as a side effect of diuretics (Wasfi et al., 2017).
As a non-invasive, readily available and cost effective way, electrocardiographics (ECGs) often used by veterinarians to evaluate the dog or cat’s cardiovascular stability preliminary. The ECG waves are created as cardiac cell action potentials depolarize or repolarize specific areas of the heart (Tag and day, 2008). The current study was carried out to clarify and compare the influence of induced - hyperkalemia and -hypokalemia on the heart conduction systems of dogs using ECG.
MATERIAL AND METHODS
Animals
This study was carried out on 18 adult healthy mongrel dogs (average BW: 17.5±2.5 Kg). All dogs were clinically healthy with no evidence of heart diseases by all means of physical and clinical examination. Three weeks prior to the experiment, dogs were individually housed separately in kennel units. These animals were regularly immunized. Dogs under experimentation were allocated into 3-groups (n=6 each); 1) animals in group-1 were infused with 2-ml of potassium chloride (KCL) solution with 0.1 mmol/L KCL per kg body weight (BW) (1000 mmol/L)/hour, 2) animals in group-2 were infused with 2-ml of KCL solution with 0.3 mmol/L KCL per kg BW (3000 mmol/L)/hour, and 3) animals in group-3 was treated with furosemide (40 mg IV/daily) for 14 days. The serum samples and ECG examination were taken at a regular time intervals (every 30 minute) for a time of 3 hours duration: i.e., Time-0 (T0, control), T1=30 minutes, T2= 60 minutes, T3= 90 min, T4 =120 minutes, T5 = 150 minutes, and T6 =180 minutes during and following KCL infusion. ECG was performed twice daily. In each group, the mean of the readouts obtained at these different time points was shown for each parameter. The whole duration of the experiment was 14 days.
Electrocardiographic examination
ECGs were conducted while animals in a right lateral recumbence position. The examinations were carried out using a single-channel ECG recorder (Cardioline, Delta1 plus). The ECG was set with a speed of 50 mm per second and with a sensitivity 10 mm = 1 mV. Following the criteria set by Tilley (1992), the evaluation was done using lead II, but when it was necessary the aid of lead II and III was indicated.
Biochemical analysis
Serum potassium level was determined using a flame photometer in accordance with the protocol set previously elsewhere (Bhattacharya et al., 1978).
Statistical analysis
One-way analysis of variance (ANOVA) test was used to value the influence of the effect of serum K changes on different echocardiographic parameters, followed by Tukey’s Honestly Significant Difference (Tukey’s HSD) test as post hoc test. All means were compared against the control group (0 time) using Dunnett’s test. The analysis was performed using Stata 16 software (StataCorp. 2019. Stata Statistical Software: Release 16. College Station, TX: Stata Corp LLC). Results are reported in mean ± SEM (Standard Error of Mean). The used value of P was less than 0.05 to indicate statistical significance.
RESULTS
Hyperkalemic groups
As shown in table-1, the mean of basal serum K level was 5.03±0.1 mmol/L. The serum K in the dogs of the first group remained constant (5.01±0.1mmol/L) without any observable ECG changes. However, in dogs of the second group, serum K level was significantly increased (5.01±0.1 mmol/L, p<0.0001) compared with the control measurements. Additionally, we found that the raised K level led to ECG changes that appeared after 1 hour of K infusion. As
Table 1: Comparison between serum potassium and electrocardiographic measurements in both hypokalemic and hyperkalemic dogs.
| Variables |
Control# |
Hypokalemia |
Hyperkalemia (0.1mmol/l) |
Hyperkalemia (0.3mmol/l) |
P-value |
| Serum K (mmol/L) | 5.03±0.1 |
4.17±0.15* |
5.01±0.1NS |
5.75±0.2** |
<0.0001 |
| P wave duration (s) | 0.03±0.001 |
0.03±0.001NS |
0.04±0.01NS |
0.02±0.001NS |
0.315 |
| P wave Amplitude (mV) | 0.18±0.03 |
0.20±0.01** |
0.16±0.09NS |
0.08±0.01** |
<0.0001 |
| PR duration (s) | 0.14±0.02 |
0.13±0.02 NS |
0.15±0.06 NS |
0.13±0.01 NS |
0.668 |
| QRS duration (s) | 0.07±0.002 |
0.05±0.003* |
0.05± 0.01* |
0.05±0.002 * |
0.027 |
| R wave Amplitude (mV) | 1.35±0.09 |
1.59±0.06** |
1.32±0.08 NS |
1.49±0.01** |
0.008 |
| T wave duration (s) | 0.04±0.001 |
0.03±0.001 NS |
0.03±0.001 NS |
0.03±0.001 NS |
0.983 |
| T wave amplitude (mV) | 0.24±0.02 |
0.07±0.01** |
0.21±0.05 NS |
0.31±0.03 ** |
<0.0001 |
| QT Interval (s) | 0.43±0.01 |
0.24±0.07 ** |
0.41±0.02 NS |
0.25±0.03** |
0.031 |
| RR interval (s) | 0.88±0.11 |
0.75±0.04 ** |
0.85±0.10 NS |
0.76±0.03** |
0.001 |
# mean of all groups prior to hypo and hyperkalemic treatments.
All means were compared against the control group using Dunnett’s test. *, **, NS: indicated p< 0.05, 0.01 and non-significant, respectively.
mV: millivolt, s: second
shown in Figure 1, some variables were increased including T-amplitude (p<0.0001) with decreasing P-wave amplitude (p<0.0001), and prolonged RR-interval (p<0.001). These changes were increased progressively through out the experiment. Also QT-interval was found increased after 2.5 hour of K infusion (p<0.03). There were no differences observed in T-duration, P-duration PR-duration between the first and second group.
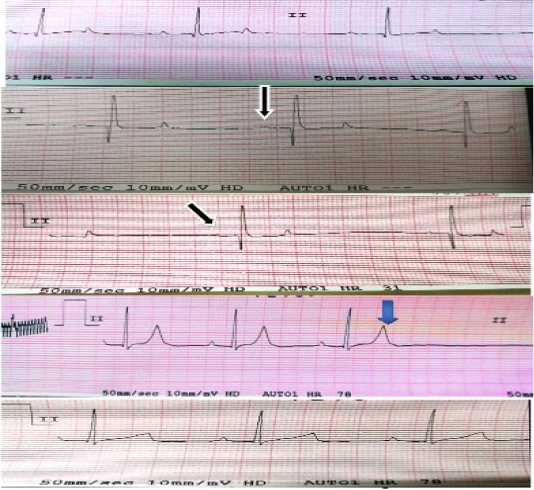
Figure 1: Electrocardiographic changes in case of hyperkalemia: Black arrows show decrease amplitude of P-waves (flat p-wave). Blue arrow shows tall peaked T-wave.
Hypokalemic group
As shown in Table-1, the mean of K level in the treated animals with furosemide started to be decreased after the fourth day of treatment (4.17±0.15mmol/L). As illustrated in Figures 2 and 3, ECG results showed that at 1st day ECG evaluation were normal in all animals. ECG tracing started to show features of hypokalemia on 3th day in some animals and at 4th day in other animals. The features of hypokalemia like bifid (notched) and flattened T-waves and prominent U-waves were showed in the ECG at 6th day. At 7-14th day, some ECG tracing showed flattening of T-waves and others showed appearance of prominent U-waves. Inverted T-wave appeared in some ECG traces at 10th day of treatment.
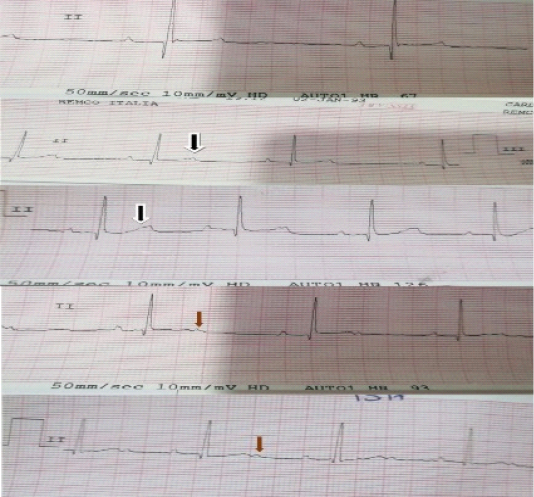
Figure 2: Electrocardiographic changes in case of hypokalemia: black arrows show bifid or notched T-waves, red arrows show appearance of prominent U-waves.
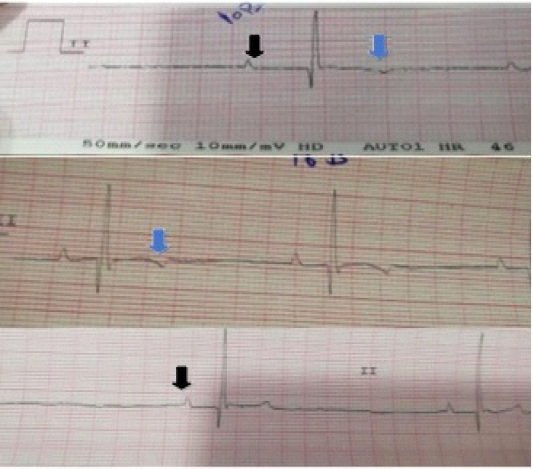
Figure 3: Electrocardiographic changes in case of hypokalemia: black arrows show peaked tall P-waves (increased amplitude), blue arrows show inversion of T-waves which appeared in some traces at 10th day of treatment.
DISCUSSION
An ECG as a diagnostic tool was not always a reliable indicator for the severity of hyperkalemia because hyperkalemia may occur without significant ECG changes (Martinez-Vea et al., 1999). Also, metabolic alterations like hypernatremia, alkalosis, or hypercalcemia can antagonize the trans-membrane effects of hyperkalemia and can result in the blunting of the ECG changes associated with elevated levels of potassium (Webster et al., 2002).
Our result showed several characteristic ECG abnormalities that were often progressive. Additionally, these data showed increase the amplitude of T-wave (peaked T-waves at serum potassium level (5.89 mmol/L) till the end point serum potassium (7.01 mmol/L) (Ronny et al., 2012).
In heart cells, hyperkalemia can result in an increase in potassium conductance. Whereas the potassium current is responsible for repolarization, the 1st manifestation of hyperkalemia is a rapid repolarization reflected on the electrocardiography as sharp peaked T waves. An increase in potassium conductance also makes the resting membrane potential more negative to a level at which sodium channels start getting inactivated (Mirvis and Goldberger, 2001). Also hyperkalemia can induce an atrioventricular nodal block (Ohmae and Rabkin, 1981) which reflected as a prolonged PR interval as well as a ventricular rhythm with wide QRS complexes (Mirvis and Goldberger, 2001). The decreases in P-wave amplitude (which may reach to be not detectable) may resulted from an ‘electrical paralysis’ of the atria (Spodick, 2008).
Whereas serum K levels increase to more than 6.5 mEq per L, the rate of phase 0 of the action potential decreases which lead into a longer action potential and in turn into a widened QRS complex and prolonged PR interval. On ECG this reflected as delayed intraventricular and atrioventricular conduction (Dananberg, 1999). In this study, QRs increased from 0.04 to 0.06 sec at serum K+ level (5.5mmol/L).
Actually, the level of serum K is genial for the regulation of depolarization and repolarization of the myocardium, so hypokalemia can alter the cardiac action potential and result in abnormities of cardiac conduction (Viera and Wouk, 2015). In the current trial, we have built a relationship between plasma potassium levels and the ECG changes in dogs. In this experiment, we induced hypokalemia with a high dose of furosemide, a potent diuretic. In the present study, the ECG showed modulation in T-waves represented as inverted T-waves, notched or bifid T-waves followed by U-waves development, these changes appeared progressively concurrently with decreased potassium levels. Similar results were recorded by (Ali, 2014).
Additionally, Our finding were consistent with El-Sherif and Turitto, (2011) who stated that the electrocardiographic changes of hypokalemia resulting from its effects on repolarization including the decrease in amplitude and broadening of T-waves, ST segment depression, and prominent U-waves; moreover T- and U-wave fusion which was prominent in severe hypokalemia. Diercks et al. (2004) expressed that many different mechanisms could contribute to the dynamic morphology of T-waves related to hypokalemia.
The development of U-wave is a common change in the ECG of hypokalemic patients. U-wave is defined as a positive deflection after the T-wave and it is often best noticed in the mid-precordial leads. During the condition of extreme hypokalemia, giant U-waves may often merge and so on smaller preceding T-waves are covered (Yan et al., 2003). Hypokalemia also can increase the diastolic depolarization of Purkinje fibers, thereby increasing automaticity and underlying the basis of U-waves (El-Sherif and Turitto, 2011) .
Tall P-waves, ST-segment depression, prominent J-waves, a prolonged QT-interval, ventricular tachycardia, premature ventricular contraction as well as torsade de pointes can also be noticed in hypokalemic patients (Khan et al., 2007; Chang et al., 2014; Kishimoto et al., 2014; Kumar et al., 2017).
The mechanism of furosemide-induced diuresis is not completely understood; inhibition of renal Na-K ATPase (Bourgoigniej et al., 1969) and adenylyl cyclase has been implicated (Ebel, 1974). The ascending loop of Henle and the most distal diluting segments located in the renal cortex were identified to be the important site of action. The filtrate presented to the Na-K ion exchange site in the distal tubule is increased in volume and total sodium content with a consequent acceleration in the rate of ion exchange and a marked kaliuresis (Velázquez et al., 1987).
CONCLUSION
The decreased P-wave amplitude and prolonged PR-interval were the common changes in ECG in hyperkalemia, whereas, the progression of U-wave was a common change in the ECG of hypokalemia in dogs.
ACKNOWLEDGEMENTS
The authors would like to thank all members of animal medicine department, Faculty of Veterinary Medicine, Zagazig University for their assistance.
CONFLICT OF INTEREST
The authors declare that they have no competing interests.
authors contribution
All authors are equally contributed in this study, read and approved the final draft of the manuscript.
REFERENCES


