Journal of Animal Health and Production
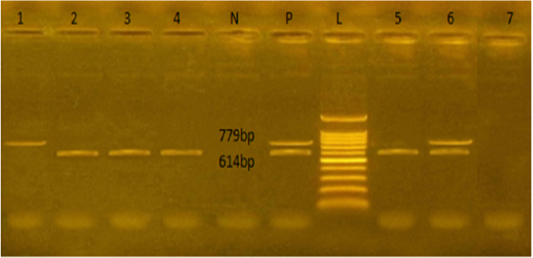
Agarose gel electrophoresis showed PCR products of E.coli stx1and stx2 genes amplified at 614 and 779 bp respectively from seven isolates. L: representing the molecular size marker (100 pb plus ladder). Lane 1 was positive to stx2, lanes 2,3,4, and 5 were positive to stx1. Lane 6 was positive to stx1 and stx2, and lane 7 was negative to stx1 and stx2. N: represents control negative, P: control positive
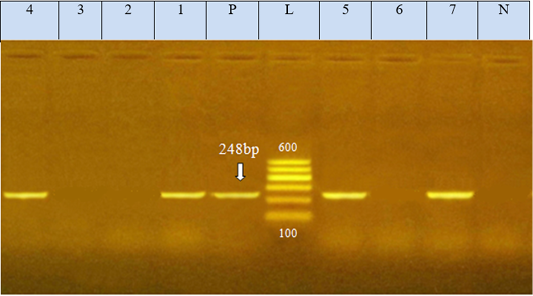
Agarose gel electrophoresis showed PCR product of E.coli eae gene amplified at 248 bp from seven isolates, N: represents negative control; P: represents positive control of eae gene (248 bp). L: represents the molecular size marker (100pb plus ladder). Lanes 1, 4, 5, and 7 were positive to eae gene. Lanes 2, 3, and 6 were negative to eae gene.
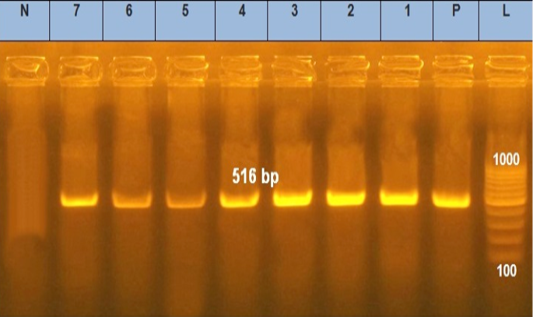
Agarose gel electrophoresis showed PCR products of E .coli blaTEM. Lane L was within 100–1000 bp DNA ladder. N: negative control; P: positive control of blaTEM gene 516 bp. Lanes 1–7 were positive to bla TEM gene
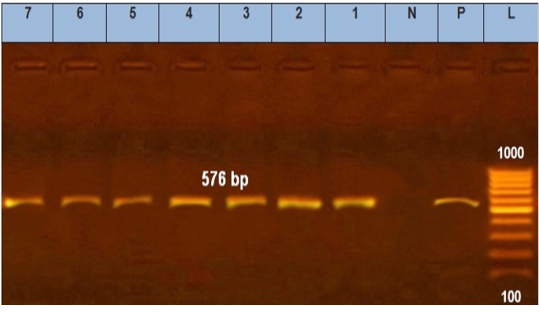
Agarose gel electrophoresis showed PCR products of E. coli tetA. N: represents negative control. P: represents positive control of tetA gene (576 bp). Lane L was within 100–1000 bp DNA ladder (1–7) positive to tetA gene.


