Journal of Animal Health and Production
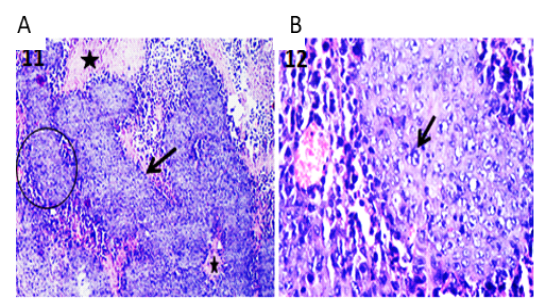
Photomicrographs of tumor sections of Ehrlich Ascetic Carcinoma (EAC) bearing mice. (A) Tumor tissue showing solid sheets of undifferentiated tumor cells (arrow) and surrounding necrotic areas (stars) admixed with inflammatory cells. H&E X100. (B) High magnification of the previous figure to show solid tumor sheet with malignancy criteria (arrow) and surrounding round cells. H&E X400.
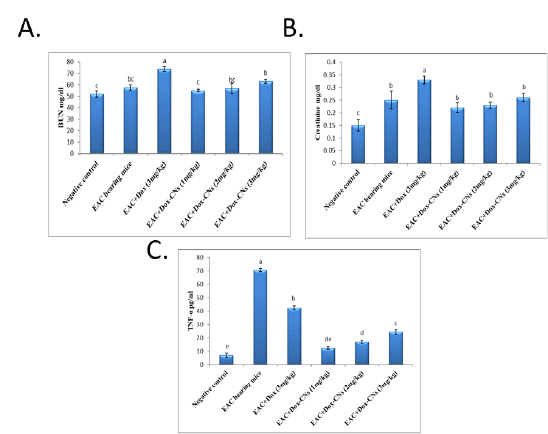
Effect of free DOX and DOX-CNs at different doses on (A) BUN (mg/dl), (B) serum creatinine (mg/dl) and (C) TNF-α (pg/ml) level. Values are mean ± SEM of 10 animals per experimental group. Means bearing different superscripts were significantly different at P < 0.05.
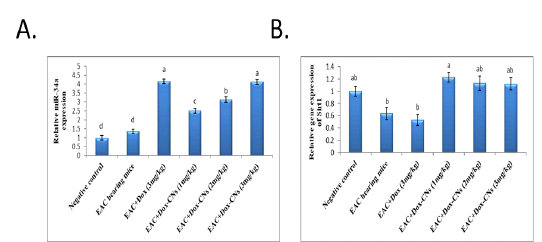
Effect of free DOX and DOX-CNs at different doses on relative expression of miR-34a (A) and its target Sirt1 (B) in renal tissue. Values are mean ± SEM. Means bearing different superscripts were significantly different at P < 0.05
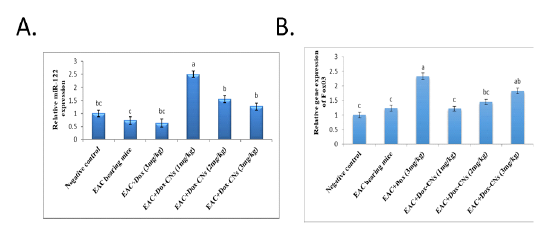
Effect of free DOX and DOX-CNs at different doses on relative expression of miR-122 (A) and its target FOXO3 (B) in renal tissue. Values are mean ± SEM. Means bearing different superscripts were significantly different at P < 0.05.
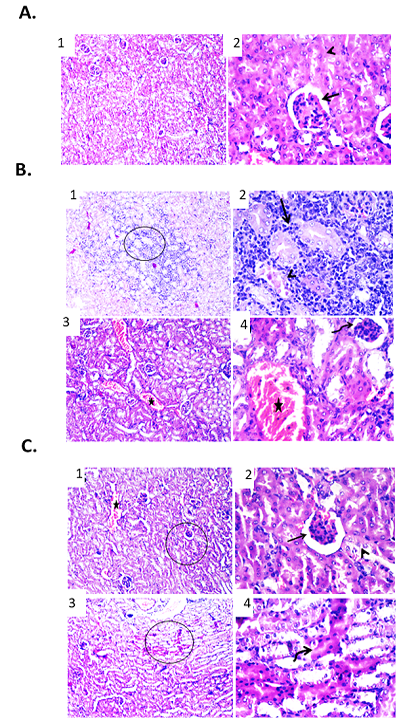
Effect of free DOX at different doses on renal tissue of male mice infected with Ehrlich Ascetic Carcinoma (EAC). (A) Photomicrographs of kidney sections of negative control group. (1) Kidney sections showing normal renal parenchyma. H&E X100. (2) High magnification of the previous figure to show normal tubular epithelium (arrowhead) and glomerular structures (arrow). H&E X400. (B) Photomicrographs of kidney sections of EAC bearing mice group. (1) Kidney showing necrotic renal tubules and metastasized neoplastic cells admixed with mononuclear inflammatory cells between renal tubules. H&E X100. (2) High magnification of the previous figure to show necrotic renal tubules (arrowhead) and metastasized neoplastic cells admixed with mononuclear inflammatory cells between renal tubules (arrow). H&E X400. (3) Kidney showing shrinkage of some glomerular structures and congestion of renal blood vessels. H&E X100. (4) High magnification of the previous figure to show shrinkage of glomeruli (curved arrow) and congestion of renal blood vessels (star). H&E X400. (C) Photomicrographs of kidney sections of EAC bearing mice treated with free DOX (3 mg/kg). (1) Kidney showing congested renal blood vessels (star) and shrunken glomeruli. H&E X100. (2) High magnification of the previous figure to show degenerative changes of some renal tubular epithelium (arrowhead) and shrunken glomeruli (arrow). H&E X400. (3) Kidney showing apoptosis of some renal tubules. H&E X100. (4) High magnification of the previous figure to show apoptotic renal tubular epithelium with deeply eosinophilic cytoplasm and pyknotic nuclei (curved arrow). H&E X400.
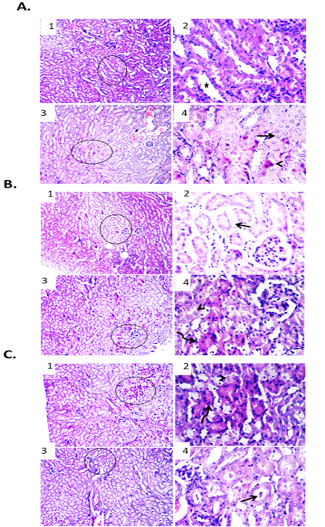
Effect of DOX-CNs at different doses on renal tissue of male mice infected with Ehrlich Ascetic Carcinoma (EAC). (A) Photomicrographs of kidney sections of EAC bearing mice treated with DOX-CNs (1 mg/kg). (1) Kidney showing normal renal parenchyma with dilated lumen of some tubules. H&E X100. (2) High magnification of the previous figure to show dilated lumen of some tubules (star). H&E X400. (3) Kidney showing degenerative changes and apoptosis of some renal tubular epithelium. H&E X100. (4) High magnification of the previous figure to show degenerative changes (arrow) and apoptosis (arrowhead) of some renal tubular epithelium. H&E X400. (B) Photomicrographs of kidney sections of EAC bearing mice treated with DOX-CNs (2 mg/kg). (1) Kidney showing apparently normal renal parenchyma with shrunken some renal tubules. H&E X100. (2) High magnification of the previous figure to show edema and extravasated erythrocytes between some shrunken renal tubules (arrow). H&E X400. (3) Kidney showing degenerative changes and apoptosis in some renal tubular epithelium. H&E X100. (4) High magnification of the previous figure to show degenerative changes (arrowhead) and apoptosis (curved arrow) in some renal tubular epithelium. H&E X400. (C) Photomicrographs of kidney sections of EAC bearing mice treated with DOX-CNs (3 mg/kg). (1) Kidney showing necrotic some renal epithelium and apoptosis of clusters of epithelial lining renal tubules. H&E X100. (2) High magnification of the previous figure to show necrotic some renal epithelium (arrowhead) and apoptosis of clusters of epithelial lining renal tubules (curved arrow). H&E X400. (3) Kidney showing protein casts in the lumen of renal tubules. H&E X100. (4) High magnification of the previous figure to show protein casts in the lumen of renal tubules (arrow). H&E X400.


