Journal of Animal Health and Production
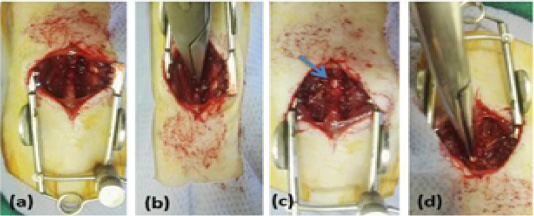
Showing surgical technique, (a) rat was in sternal position with sterilized dorsal area, longitudinal incision of skin and sharp incision of the muscles overlying the vertebral column T8–T11, (b) Laminectomy was done at T9, (c) exposing spinal cord (arrow), (d) Compression of the spinal cord with mosquito forceps for 15 sec.
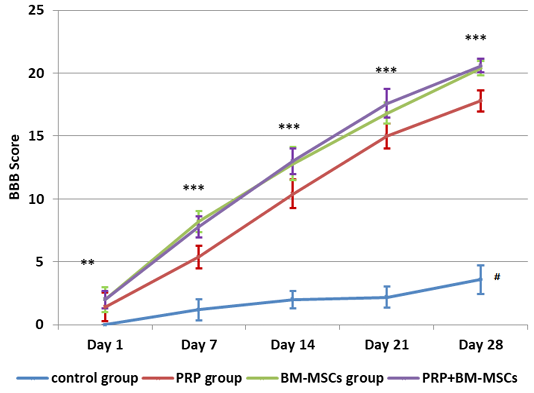
showing BBB Score evaluation of hind limb locomotor recovery. # Lower significance than all other groups; ** Lower significance of PRP group than PRP+BM-MSCs group; *** Lower significance of PRP than BM-MSCs and PRP+BM-MSCs groups.
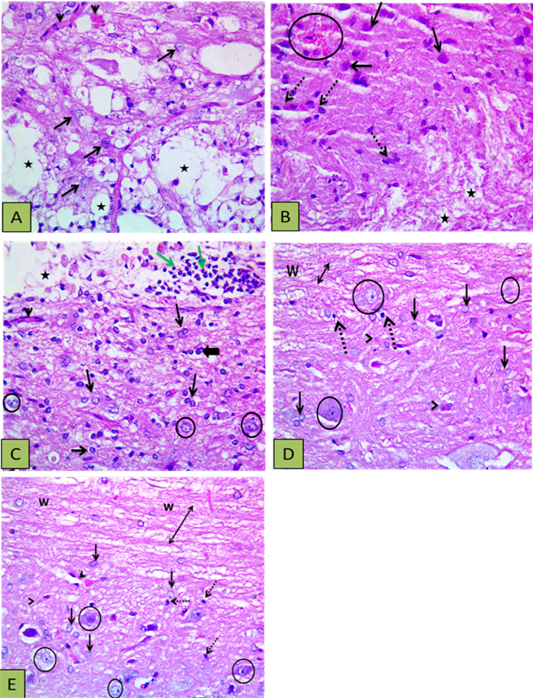
Showing histopathological findings. (A) Control group showing defective myelination (numerous areas of cavitation) (stars), reactive and increased size astocytes (arrows), and congested blood vessels (arrowheads); (B) Other section of control group showed the white matter with disrupted myelination (stars), the gray matter with numerous gemistocytic cells (reactive astrocytes shown by intact arrows), microglial cells proliferation (dashed arrows), and localized hemorrhage (circle); (C) PRP group showed astrocytic proliferation with increased size (reactive astrocytes) (thin arrows) oligodenrocytes (thick arrow), mild vascularity (arrowheads), with light stained intact neurons (circle) and white matter disruption (vacuoles shown by star) with inflammatory cells infiltration (green arrows); (D) BM-MSCs group showed intact axons (double heads arrow ) within white matter (w) and the grey matter showing astrocytic proliferation with increased size (blck arrows), oligodenrocytic proliferation (dashed arrow) minimal vascularity (arrowheads), with light stained intact neurons (circle); (E) PRP+BM-MSCs showing well myelinated nerve cells (upper side) (double heads arrow) within the white matter (w), astrocytic proliferation with increased size (intact arrows), microglia proliferation (dashed arrow) minimal vascularity (arrowheads), with light stained intact neurons (circle). H and E Photomicrograph with X400.
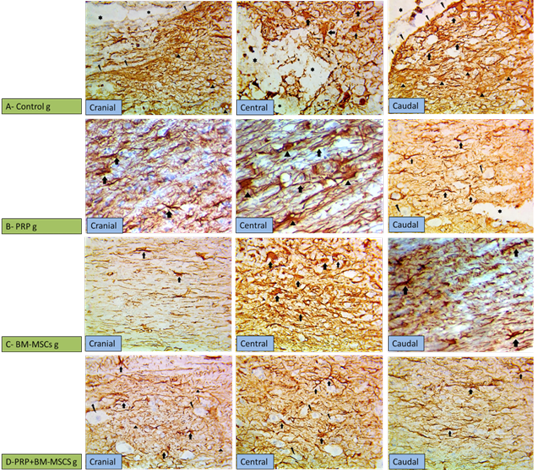
Showing immunohistochemical findings. (A) Control group showing wide injured area (star) in the gray matter with down regulation of GFAP at the center of the lesion with high expression of GFAP surrounding the lesion cranial and caudal to the lesion, noticed in the markedly hypertrophied astrocytes and their thickened processes (arrows), more thicker processes of astrocytes (arrow heads) denoting gliosis scar (broken arrows); (B) PRP group showing moderate expression of GFAP cranial and caudal to the lesion with marked gliosis centrally due to the increased number of astrocytes and their thickened processses (arrows); (C) BM-MSCs group, showing mild overexpression of GFAP cranial and caudal to the lesion with high overexpression (arrows) astrocytes due to thickening of their processes at the central area; (D) PRP+BM-MSCs group showing well distributed expression of GFAP denoting the normal expression with very few reactive astrocytes (arrows) in between neurons (broken arrows) cranial and caudal to the lesion and mild overexpression of GFAP at the central area of the lesion. (GFAP stain, x400).


