Journal of Animal Health and Production
Research Article
J. Anim. Health Prod. 9(s1): 9-16
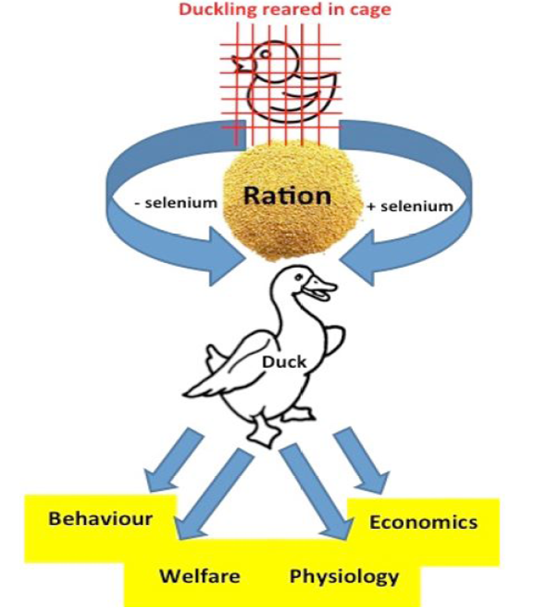
Figure 1
Experimental design of the work.
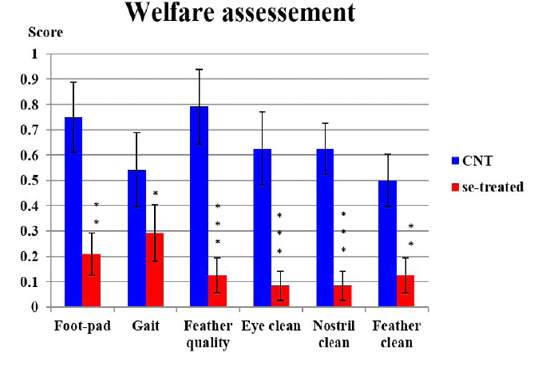
Figure 2
Welfare assessment scores in control and selenium supplemented diet groups of Muscovy duck, at week-10 of age. The result was presented as mean ± SEM and analyzed using t-test, SPSS-version 16. CNT, control; se-treated, selenium-treated; (*), P ≤ 0.05; (**), P ≤ 0.01; (***), P ≤ 0.01.
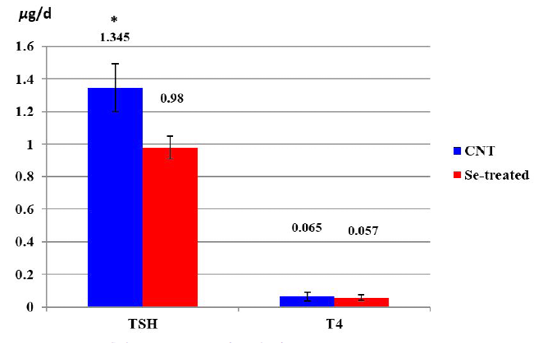
Figure 3
The level (µg/dl) of thyroid stimulating hormone and thyroxine hormone in control and selenium supplemented diet groups of Muscovy duck at week-7 of age. The result was presented as mean ± SEM and analyzed using t-test, SPSS version 16; (*), P ≤ 0.05.; CNT, control; se-treated, selenium-treated; TSH, thyroid-stimulating hormone; T4, thyroxine.


