Journal of Animal Health and Production
Research Article

Identification of Genetic Association among Different Colors of Korean Native Chicken Breeds through the RAPD-PCR Method
Sang-Hwan Kim*
Institute of Genetic Engineering, Hankyong National University, 327, Jungang-ro, Ansung, Gyeonggi-do, 17579, Korea.
Abstract | The present study aimed to evaluate the genetic distance between Korean native chickens (red plumage, red-line plumage, and Ogol) and white leghorn and identify specific DNA markers using the random amplified polymorphic DNA (RAPD)-PCR method. Genomic DNA was extracted from the plumage of chickens after they were slaughtered. RAPD analysis was performed using 12 different primers to determine the genetic relationship among the chickens. Statistical analysis was performed for estimating the genetic distance among the chickens and a cluster tree was constructed using the MEGA 5.05 software. The percentage of polymorphic bands was 72% and the remaining 28% was monomorpic. The largest genetic distance (2.266) was found between native chickens (red, red-line) and Ogol chickens by UPGMA method and the close proximity was observed among the Ogol in Korean chickens as expected. Dendrogram analysis showed two clusters, I and II, and most of the Ogol chickens were placed in subcluster IIB within cluster II, indicating that the expression of Ogol color could be due to original and ancestral genetic crossing. Thus, genetic diversity analysis provides important data for the identification of chickens.
Keywords | RAPD, UPGMA, MC1R, Plumage color, Korean native chicken
Received | August 03, 2020; Accepted | November 27, 2020; Published | December 01, 2020
*Correspondence | Sang-Hwan Kim, Institute of Genetic Engineering, Hankyong National University, 327, Jungang-ro, Ansung, Gyeonggi-do, 17579, Korea; Email: ohmyfamily@naver.com
Citation | Kim S-H (2021). Identification of genetic association among different colors of Korean native chicken breeds through the RAPD-PCR method. J. Anim. Health Prod. 9(1): 33-39.
DOI | http://dx.doi.org/10.17582/journal.jahp/2021/9.1.33.39
ISSN | 2308-2801
Copyright © 202 Kim, This is an open access article distributed under the Creative Commons Attribution License, which permits unrestricted use, distribution, and reproduction in any medium, provided the original work is properly cited.
INTRODUCTION
Korean chickens are in endangered due to continued improvements through breeding since 1952 (Sang et al., 2006). For this reason, genetic diversity analysis of Korean chickens is very important. The red ancestor, red jungle fowl (Gallus gallus), produces various colors during the breeding process. Although studies on genes related to feather color can provide genetic markers for breed identification, studies on genetic diversity analysis of Korean chickens are limited. Indigenous chickens have a record of more than seven generations of Korean native chickens and breeds from foreign countries and include all indigenous species that have been maintained purely (Kang, 2010). However, the term “Korean native chicken” is used only for traditional chicken in academic terms such as in research reports and papers (Korea National Institute of Animal Science, 2008). Recently, molecular biological studies using next generation sequencing (NGS) have been actively conducted (Eck et al., 2009), and the Korean chickens have been classified as H type with black background brown and L type with black line. However, the phenotypic and genotypic characteristics of this grouping are not yet clear. To date, the usual method of grouping chickens is using melanocortin receptor 1 (MC1R) genetic variation to identify the function of pheomelanin or eumelanin associated with the color of the chickens (Lee et al., 2002; Xu et al., 2016). However, the identification of color pattern of Korean chickens based on MC1R variation is not yet clear. Moreover, alternative methods such as NGS and single nucleotide polymorphism (SNP) for random marker analysis can be used, but the analysis process is complicated and difficult to understand. Therefore, the use of RAPD-typing has been widely used since the 1990s, as it is easy to compare and analyze the genetic variation between species and varieties (Garrigan et al., 2002; Kim et al., 2011). At present, there are diverse opinions regarding native and livestock chickens. Therefore, this study aimed to compare the genetic diversity among native red, native yellow-red, and black chickens (Ogol), which are thought to be isolated from the native chickens in Korea. These data may be considered important for the identification and discovery of Korean native chickens.
MATERIALS AND METHODS
Animals
Native red, native yellow-red, and black chickens raised by the National Institute of Animal Science, Gyeonggi-do, Korea were visually selected for the present study (Figure 1). Domestic broilers raised by the National Livestock Science Institute were chosen as controls.
Sample collection and extraction of genomic DNA
Samples were collected by slaughtering randomly selected 10 animals from each group, following the procedures of Kang (2010). The epidermal and muscular sections of the outer plume were collected and used in the experiment. For genomic DNA extraction, 250 mg of plume section of each Korean native chicken was crushed in liquid nitrogen, stored in 1.5 ml tubes, then DNA was extracted by Invitrogen Easy DNA kit (Invitrogen, CA, USA). For removal of RNA, 40 µg/ml of RNase was added and incubated at 4 oC for 30 min. Finally, 500 ng/µl of DNA, with 260/280 ratio between 1.9 and 2.0, was obtained as measured by nano-spectrometer.
MC1R gene analysis of the Korean native chickens
For conducting the PCR-RFLP of the MC1R gene, MC1R primer was designed based on the nucleotide sequence information (Gene accession no. NC_018927.2) from NCBI (http://www.ncbi.nlm.nih.gov) as described by Dorshorst et al. (2011) and Xu et al. (2016) (Forward primer: 5’ agaaacaagggtcaaggtgagc 3’, Reverse primer 1: 5’ gggatggctctcacataaaagg 3’, Reverse primer 2: 5’ tggatcattggaggaagtgttg 3’). The extracted DNA was quantified using nano-spectrometer and standardized to obtain a concentration of about 200 ± 30 ng/µl. The PCR mix consisted of 10 pmol forward/reverse primer, 1µl of 2.5 mM template DNA, 2.5 µl of 10X PCR buffer, 2 units of Taq polymerase (Toyobo, JPN), and distilled water (Total PCR product volume: 25ul). The reaction conditions were as follows: pre-denaturation at 95 oC for 10 min; 35 cycles of denaturation at 95 oC for 30 s, annealing at 58 oC for 30 s, extension at 72 oC for 1 min; and final extension at 72 oC for 5 min. To analyze MC1R gene variants, 10 µl of PCR product was mixed with 2 units of MspI (Toyobo, JPN) and 2 µl 10× M buffer at 37 oC and incubated for 4 h. Next, agarose gel electrophoresis using 2% agarose was performed, and the pattern of DNA bands was classified according to the method described by Kim et al. (2011).
RAPD-PCR analysis for genetic evaluation
URP markers (JK, Anseong, KOR) were used for designing five sets of primers with GC content over 60% of the total sequence for RAPD-PCR analysis. The PCR mix consisted of 25 µl of PCR preparation solution, 100 ng/µl of DNA mixed with 2 µl of 10× reaction buffer, 2.5 mM dNTPs, 10 pmol of URP primer, 2 units of Taq DNA polymerase, and distilled water. The reaction conditions were as follows: initial denaturation for 5 min at 95 oC; 40 cycles of denaturation at 94 oC for 1 min, annealing at 60 oC for 1 min, and extension at 72 oC for 1 min; and final extension at 72 oC for 8 min.
Electrophoresis and genetic diversity analysis
To identify the polymorphic patterns of the gene, electrophoresis was performed for 1 h at 100 V on 3% agarose gel and the gel was observed under a UV transilluminator (UVP-UK). The bands were identified by comparing with the standard molecular weight (MW) ladder DNA. For phylogenetic analysis, the samples were analyzed using AlphaEase FC and MEGA5.05 software following the method of Khatun et al. (2012) and Tamura et al. (2004, 2011). A dendrogram was drawn using the unweighted pair group method with arithmetic averages (UPGMA) method using MEGA 5.05 software after the data were coded as 1 for banding and 0 for no banding. The genetic distance was computed using the following formula devised by Kim et al. (2011), dxy = 1–[2nxy/(nx+ny)], where nx and ny = no. of bands; and 2nxy = no. of common bands between the individuals. The experiment was repeated thrice to obtain consistent results.
RESULTS
Phenotypic differences between red, yellow-red, and black chickens, and the analysis of MC1R patterns
Each chicken, except black chickens, is composed of a mixture of dark brown and black colors in addition to red (KCR) and yellow-red (KCRD) colors. Red brown and black colors are prominently formed on the back and tail. The external differences were clearly defined, and in case of black chicken, the black color was typical without any mixing (Table 1). The FM (fibromelanosis) allele was detected in all birds using the method reported by Dorshorst et al., 2011. The results of FM genotyping (band size: 379 bp, 280 bp) showed that all the birds with the “black (KCO)” and “livestock (W)” chicken phenotypes carried the FM allele, whereas all the birds with the “red (KCR)” and “yellow-red (KCRD)” chicken phenotypes did not harbor this allele (Figure 2).
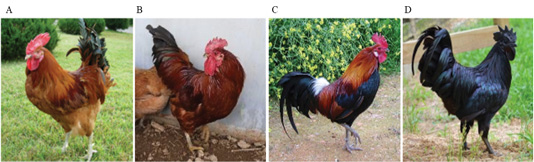
Figure 1: Photographs of the Korean native chicken breeds. A: Korean wild chicken (W), B: Korean native chicken Red-line (KCR), C: Korean native chicken Yellow-red line (KCRD), D: Korean native chicken Black line (Ogol; KCO).
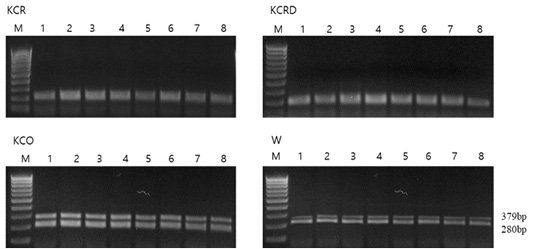
Figure 2: Genotype pattern of FM PCR (MC1R) diagnostic test products. All chickens with W and Black type phenotype carry the FM allele while all chickens with Red and Yellow-red type phenotype do not carry the FM allele. KCR: Korean native chicken red, KCRD: Korean native chicken red-yellow (deep red), KCO : Korean chicken Ogol (Black-line).
Analysis of genetic diversity among KCR, KCRD, and KCO groups using RAPD marker
Genetic diversity analysis using primary RAPD-typing by mixing DNA of each group showed that there was a difference in the genetic distance among KCR, KCRD and KCO groups. The genetic distance between KCR and KCRD was 0.62, which indicates close relatedness; it was 7.38 between KCR and KCO. The largest genetic distance of 7.58 was observed between KCRD and KCO (Figure 3).
Genetic distance among individuals of each group
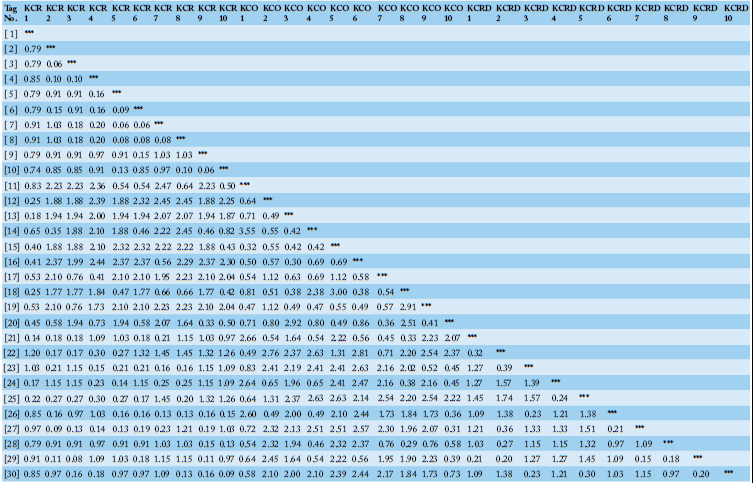
As a result of RAPD-typing analysis using a total of 12 sets of RAPD-primers, a total of 186 bands were identified, of which, 53 were polymorphic and 133 were monomorphic (Table 2). The total diversity was measured to be 39.84%. For KCR, a genetic distance of 0.41 was observed between clusters I and II. In case of KCRD, two chickens were distributed in cluster I, the rest were distributed in cluster II, and the distance between the two clusters was 0.54. Contrary to the above results, the genetic distance between clusters I and II in KCO did not show a big difference (0.23) (Figure 4). Therefore, three of the published species in KDR and two in KCRD were found to be different in each group.
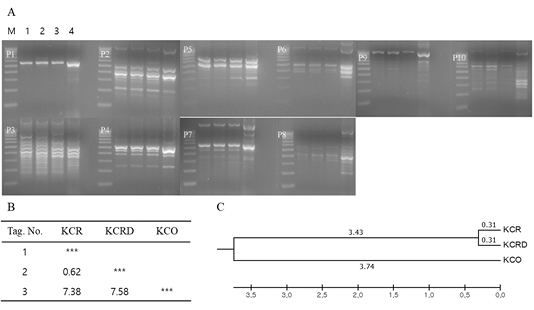
Figure 3: Analysis of polymorphic patterns in DNA poll of each group using URP-primer. Evolutionary relationships of taxa. The evolutionary history was inferred using the UPGMA method. The optimal tree with the sum of branch length = 1.09229610 is shown. The analysis involved 3 nucleotide sequences. Codon positions included were 1st+2nd+3rd+Noncoding. All positions containing gaps and missing data were eliminated. Evolutionary analyses were conducted in MEGA5. A: Agarose gel image of polymorphic pattern, B: Pairwise genetic distance, C: Dendrogram, M: 100bp DNA ladder, lane 1: W, lane 2: KCR, lane 3: KCRD, lane 4: KCO, KCR: Korean native chicken red, KCRD: Korean native chicken red-yellow (deep red), KCO: Korean chicken Ogol (Black-line).
Genetic distance among the groups
Genetic distances of clusters I and II were found to be 0.24 and 0.08 in all three clusters (Table 3). All KCO chicken lines belonged to cluster I, and most of the KCR and KCRD chicken lines belonged to cluster II (Figure 5). The difference in genetic distance between KCR and KCRD was low, indicating their genetic similarity.
Dendrogram analysis
By analyzing the difference between 10 livestock chicken lines (W) provided by the National Institute of Animal Science and the KCR, KCRD, and KCO groups, it was confirmed that except KCO, the other 3 groups belonged to the same cluster, i.e., cluster I. KCO belonged to cluster II, which was divided into subclusters IIA and IIB as shown in Figure 6, but the difference in genetic distance between individuals was low. In contrast, cluster I consisted of subclusters IA and IB, and one I was included in IB and one in KOC and KCRD, but the included in most cluster IAW was included in cluster IA (2), and KCR and KCRD chicken lines were included in cluster IA (1).
Table 1: Phenotype of plumage color of Korean native chickens breeds.
| Observation item | Age | Chicken breeds (No.) | ||||
| Variable | location | Yellow-red line (n= 10) | Red line (n= 10) | Ogol (n= 10) | ||
| Hair color within 1 week | 1 week | red | yellow-red | black | ||
| Feather color within 1 week | yellow-red | yellow-red | black | |||
| Body color | Neck | 8 week | red | red | black | |
| Chest | red | red | black | |||
| Back | yellow-red | red | black | |||
| Tail | black/yellow-red | black | black | |||
| Feather pattern | Neck | 8 week | - | - | - | |
| Chest | - | - | - | |||
| Back | yellow-red /- | black/- | - | |||
| Tail | black/- | black/- | - | |||
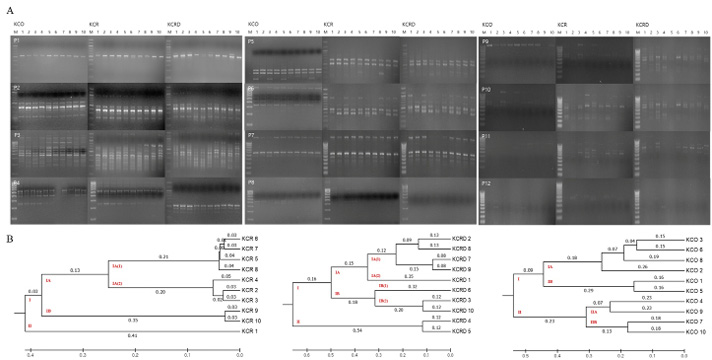
Figure 4: Analysis of polymorphic patterns in DNA samples. A: RAPD profiles using URP primer between Korean chickens. B: The unweighted pair group method of analysis (UPGMA) dendrogram based on summarized data regarding differentiation among chickens. KCR: Korean native chicken red, KCRD: Korean native chicken red-yellow (deep red), KCO: Korean chicken Ogol (Black-line).

Figure 5: The unweighted pair group method of analysis (UPGMA) dendrogram based on summarized data regarding differentiation among Korean chickens. KCR: Korean native chicken red, KCRD: Korean native chicken red-yellow (deep red), KCO: Korean chicken Ogol (Black-line).
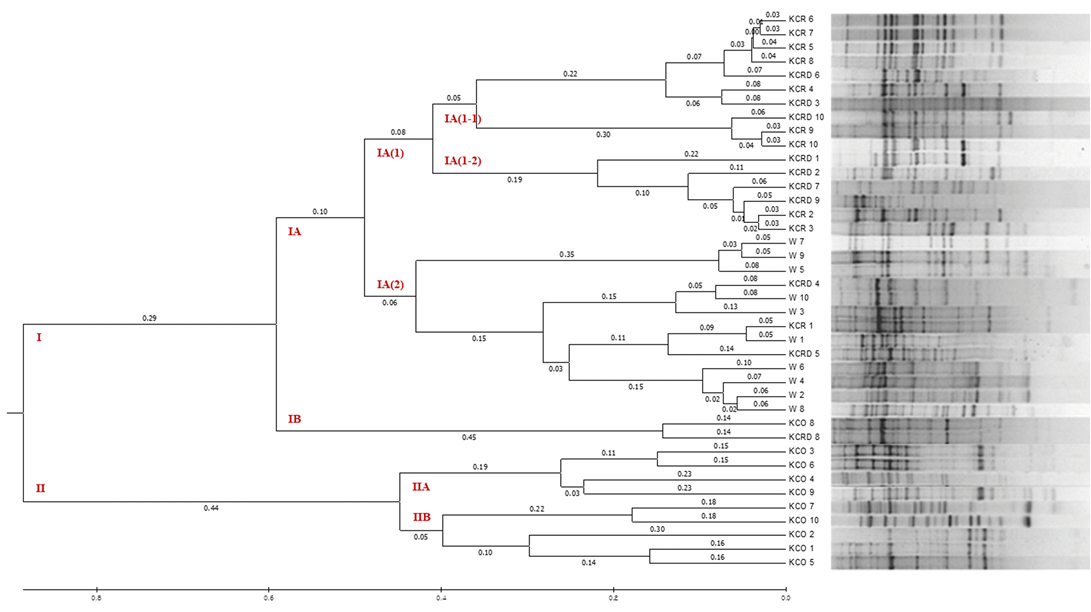
Figure 6: The UPGMA dendrogram based on summarized data regarding differentiation between Korean chickens and Korean wild chicken. W: Korean wild chickens, KCR: Korean native chicken red, KCRD: Korean native chicken red-yellow (deep red), KCO: Korean chicken Ogol (Black-line).
Table 2: List of detected monomorphic and polymorphic bands.
| Primer code | band | No. of polymorphic bands | No. of monomorphic bands | Polymorphism (%) |
| URP-01 | 8 | 1 | 7 | 2.5 |
| URP-02 | 24 | 10 | 14 | 41.7 |
| URP-03 | 38 | 15 | 23 | 39.5 |
| URP-04 | 12 | 3 | 9 | 25.0 |
| URP-05 | 17 | 0 | 17 | 0.0 |
| URP-06 | 18 | 5 | 13 | 27.8 |
| URP-07 | 17 | 7 | 10 | 41.2 |
| URP-08 | 14 | 6 | 8 | 42.9 |
| URP-09 | 7 | 1 | 6 | 14.3 |
| URP-10 | 15 | 3 | 12 | 20.0 |
| URP-11 | 11 | 2 | 9 | 18.2 |
| URP-12 | 5 | 0 | 5 | 0.0 |
| Total=12 | 186 | 53 | 133 | 39.84 |
DISCUSSION
The breeding of native chickens in Korea has been very active since 2009 and has become an important topic of research in the poultry industry. However, there have been numerous problems associated with the source and investigation of native chicken. While many researchers have focused on the variation of MC1R and TYR, there have been many issues in securing the bloodline based on the exact evidence of the origin and genetic differences (Lee et al., 2014). The pedigrees in this study consisted of only roosters that completed the MS and genetic analyses according to the NGS on the candidate axis introduced by the National Livestock Science Institute (KNIAS, 2008). To analyze the difference between the red and yellow-red lines, 10 chickens were randomly selected and tested in each group. Even though the RAPD-typing technique used in the present study might be less reliable than newer techniques, it is possible to observe the genetic differences according to each cluster and determine the variations and similarities among them (Kim et al., 2011). Previously, it was difficult to confirm the difference according to each cluster in the MC1R analysis results (Xu et al., 2016). For black chickens, it has been confirmed that there is a genetic variation of MC1R, but it has been difficult to confirm the variation of MC1R between red and yellow-red chickens. Our results were slightly different from the findings of Park et al., 2013; thus, many other genetic specificities in addition to MC1R mutation might exist. The results obtained varied considerably from the results of conventional MS typing for the red and yellow-red lines (Choi et al., 2012). However, the results of genetic diversity analysis within the cluster were similar to the results obtained by Seo et al. (2015). In our results, the genetic distance between the red and yellow-red chicken lines was 0.62, indicating close proximity, but varied considerably from the black line KCO.
In particular, comparison with the control group showed a markedly large difference. In cluster IA (1), the identified yellowish brown and red chickens were present in IA (1-1) and IA (1-2), respectively, and most of the KCRD lines belonged to IA (1-2); accordingly, we confirmed that the differences within the Korean native chickens formed the origin of chicken breeding. Genetic differences in the differentiated populations of the same line were also observed, and these were similar to the findings of Oh et al. (2010), who confirmed the genetic difference between native and livestock chicken lines.
Therefore, we conclude that in the breeding population of native chicken in Korea, the red and yellow-red chicken lines, which are thought to be differentiated from the livestock chicken lines, appear to be genetically similar. However, the genetic distance between native livestock chicken and black chicken lines was high. Therefore, although our study could not observe the genetic variation in all chicken lines, we can suggest the lineage relationship among the chicken groups.
Authors Contribution
All authors conributed equally.
Conflict of interest
The authors have declared no conflict of interest.
References


