Journal of Animal Health and Production
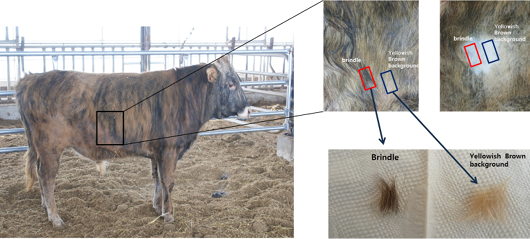
Samples for NGS analysis.
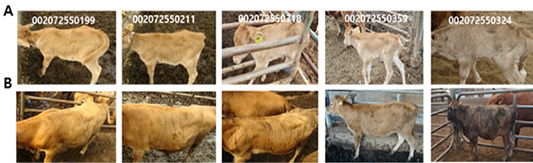
Samples for DNA methylation analysis- A: at 1 month of age, B: at 6 months of age.
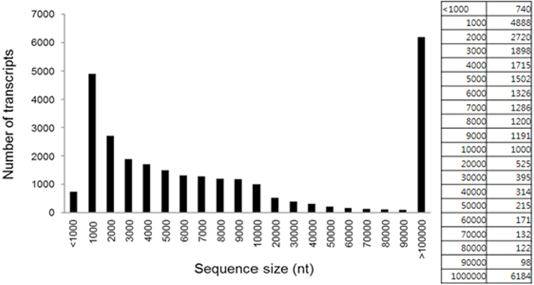
Length distribution and abundance of all transcripts identified in both the yellow background and brindle section.
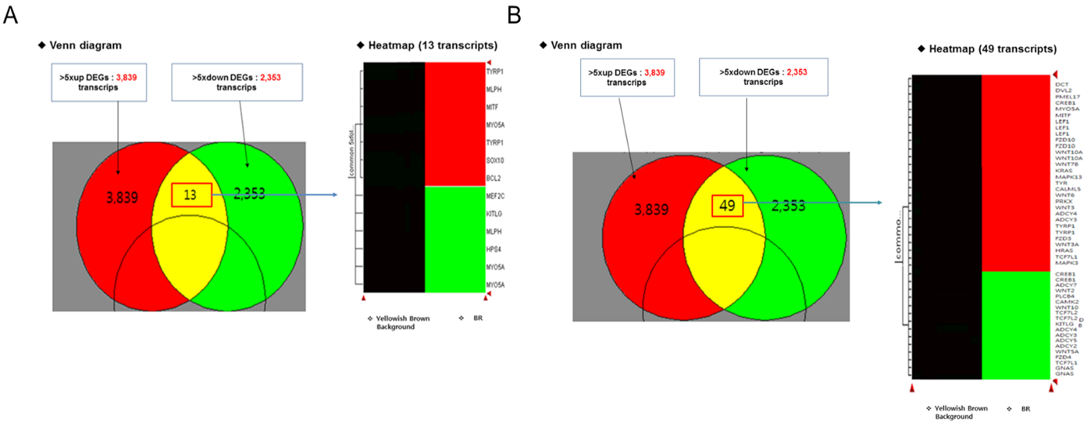
Profile analysis of the skin transcriptome in the brindle coat-Yellow zone: melanocyte-associated gene (common in >5×fold), A: melanocyte differentiation: 13 transcripts, B: melanogenesis differentiation: 49 transcripts.
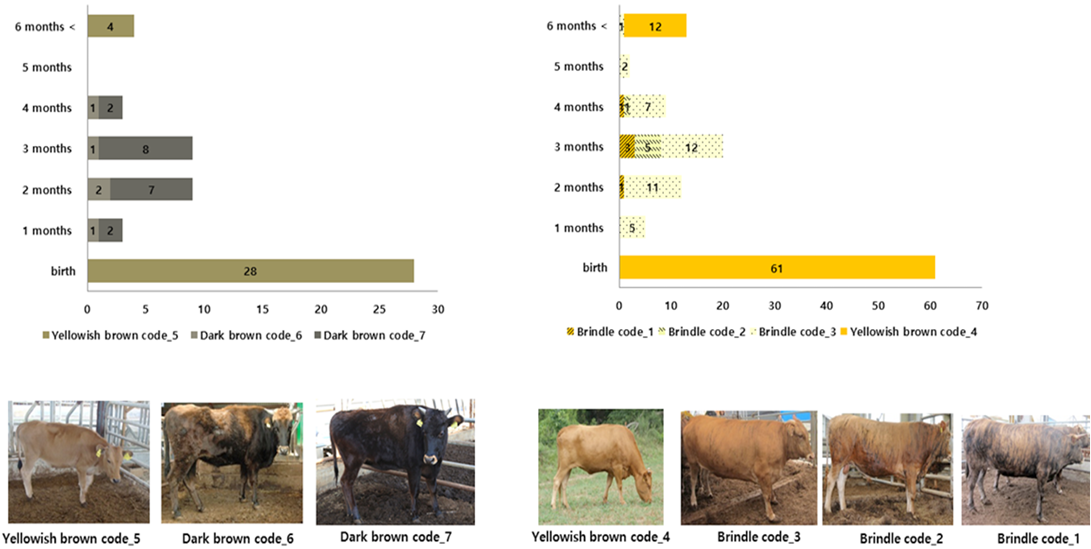
Changes in coat color depending on the growth stage.
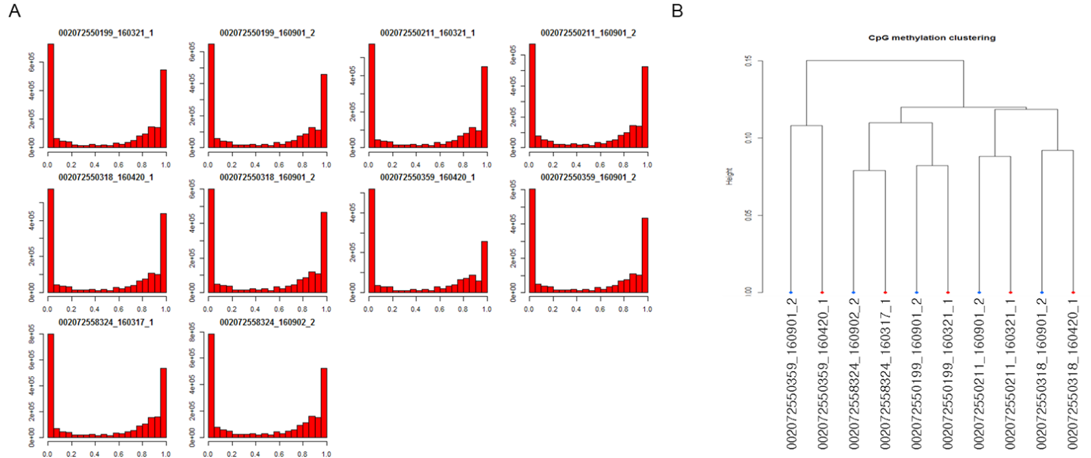
Methylation level distribution among brindle cattle- A: methylation level, B: clustering by CpG methylation.
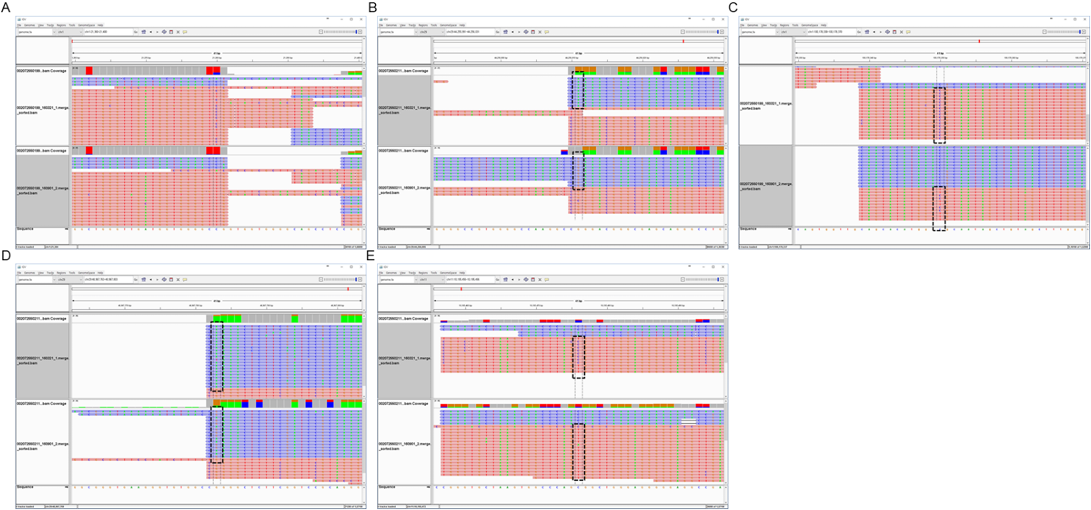
Hypomethylation in the brindle section- A: CpG chr1:21380(+) hypomethylation at brindle 002072550199, B: CpG chr29:44256011(-) hypermethylation at brindle 002072550211, C: CpG chr1:100178350(+) hypomethylation at brindle 002072550318, D: CpG chr11:48967783(-) hypermethylation at brindle 002072550359, E: CpG chr11:10195476(+) hypomethylation at brindle 00207255032.


