Journal of Animal Health and Production
Research Article

Assessment of Relationship between Body Weight and Morphological Traits of South African Non-descript Indigenous Goats
Thobela Louis Tyasi*, Madumetja Cyril Mathapo, Kwena Mokoena, Dannis Maluleke, Lebo Trudy Rashijane, Kgotlelelo Maaposo Makgowo, Lebogang William Danguru, Kagisho Madikadike Molabe, Paul Mogowe Bopape, Nhlakanipho Divine Mathye
School of Agricultural and Environmental Sciences, Department of Agricultural Economics and Animal Production, University of Limpopo, Private Bag X1106, Sovenga 0727, Limpopo, South Africa.
Abstract | South African non-descript indigenous goats are poorly managed and tolerant of diseases and parasites. The study was conducted to investigate the relationship between body weight (BW) and morphological traits such as; withers height (WH), body length (BL), rump length (RL), rump height (RH) and heart girth (HG) and to determine the level of correlation among these traits and BW. One hundred South African non-descript indigenous goats (does = 80 and bucks = 20) age one to four year were used as experimental animals. Descriptive statistics indicated that does had a higher mean values (P<0.05) in all morphological traits as compared with bucks. Pearson correlation and simple regression analyses were used for data analysis to achieve the study objectives. Pearson correlation findings revealed that BW had a positive highly statistical significant (P<0.01) correlation with WH (r = 0.70), RH (r = 0.40) and BL (r = 0.54) in does while BW of bucks had a negative statistical significant (P<0.05) correlation with RL (r = -0.26), positive correlation with WH (r = 0.28), positive highly statistical significant correlation with BL (r = 0.37) and low correlation with HG (r = 0.06). Regression analysis developed models for each morphological trait and the findings indicated that withers height had a highest coefficient of determination (R2 = 0.49) and lowest mean square error (MSE = 46.17) in does, while rump height had a highest R2 (0.21) with lowest MSE (88.44) in bucks. In conclusion, relationship findings suggest that by improving WH, RH and BL might result the improvement of BW in South African non-descript indigenous goats. Simple regression results suggest that WH and RH could be used as a selection criterion throughout breeding to improve BW of indigenous goats. Findings of the current study might be used by indigenous goat farmers as selection criteria and for creation of an appropriate breeding program for improvement of BW based on morphological traits.
Keywords | Withers height, Body length, Rump height, Rump length, Heart girth
Editor | Asghar Ali Kamboh, Sindh Agriculture University, Tandojam, Pakistan.
Received | February 08, 2020; Accepted | March 01, 2020; Published | March 31, 2020
*Correspondence | Thobela Louis Tyasi, School of Agricultural and Environmental Sciences, Department of Agricultural Economics and Animal Production, University of Limpopo, Private Bag X1106, Sovenga 0727, Limpopo, South Africa; Email: louis.tyasi@ul.ac.za
Citation | Tyasi TL, Mathapo MC, Mokoena K, Maluleke D, Rashijane LT, Makgowo KM, Danguru LW, Molabe KM, Bopape PM, Mathye ND (2020). Assessment of relationship between body weight and morphological traits of South African non-descript indigenous goats. J. Anim. Health Prod. 8(1): 32-39.
DOI | http://dx.doi.org/10.14737/journal.jahp/2020/8.1.32.39
ISSN | 2308-2801
Copyright © 2020 Kumar et al. This is an open access article distributed under the Creative Commons Attribution License, which permits unrestricted use, distribution, and reproduction in any medium, provided the original work is properly cited.
Introduction
South African non-descript goat is a goat breed which is commonly kept in rural areas of South Africa (Webb et al., 2003). According to Ramukhithi et al. (2019) non-descript indigenous goats are resistance to diseases and parasites. This breed is one of the non-selective browsers and survive well in harsh environment (Mara et al., 2013). Indigenous goats arrived in South Africa with migrating tribes and are found in the specific areas where the different ethnic groups settled (Webb et al., 2003). These animals are highly fertile even from a young age, have a long breeding season and produce offspring the year through (Norris et al., 2015). These goats are non-descript and unimproved (Body weight is one of the most important economical traits in meat industry (Ulutas et al., 2010; Dekhili and Aggoun, 2013; Aksoy et al., 2016). Body weight helps farmers during marketing, vaccinations, feed estimation and selection during the breeding programs for improving body weight (Norris et al., 2015; Tyasi et al., 2020). Studies regarding the relationship between body weight and morphological traits of goat have been carried out in other regions of the world and the possible use of morphological traits to estimate live body weights (Singh and Mishra, 2004; Slippers et al., 2000; Mahieu et al., 2011; Onder et al., 2015). Moreover, communal farmers find it difficult to get an access to weighing scale, as it is very much expensive (Nsoso et al., 2003). Morphological traits are reported as a suitable tool to estimate the live weight of animals (Adeyinka et al., 2006; Khan et al., 2006; Mahieu et al., 2011; Pesmen and Yardimci, 2008; Ulutas et al., 2018). Based on our knowledge, there is limited information for the assessment of relationship between body weight and morphological traits in South African non-descript indigenous goats. Hence, the objectives of the current study were 1) to determine the relationship between body weight and morphological traits (withers height, body length, rump length, rump height and heart girth) of indigenous goats using Pearson correlation and 2) to determine the effect of morphological traits in body weight of indigenous goats using simple regression procedure. The study will help communal farmers to understand the link between body weight and morphological traits and to use morphological traits as a predictor of body weight for vaccinations, feeding, marketing and breeding programs of indigenous goats.
Materials and Methods
Study area and animal management
The study was carried out in a research station as described by Alabi et al. (2012). A total of 100 South African non-descript indigenous goats (n= 80 does, n = 20 bucks) from the age of one to four years old were used as the experimental animals. All the goats were allowed to graze freely in the camp and comeback to the kraal in the afternoon for protection against theft and predators. Management like dipping and vaccination were practiced to prevent the animals against internal and external parasites. Containers which are used to carry water were cleaned and the animals were supplied with clean and suitable water.
Measurements of studied traits
Body weight was measured using a weighing scale while morphological traits were taken using measuring tape and wood ruler. All the measurements were taken following the procedure of Norris et al. (2015). Shortly, body length (BL) was measured from the head of humerus to the distal end of the pubic bone. Rump height (RH) was measured from the top of the pelvic girdle to the ground surface in relation to the level of hind legs. Rump length (RL) was measured from the hip to the pin. Withers height (WH) was measured from the highest point of the shoulder to the ground surface in relation to the level of the fore legs. Heart girth (HG) was measured of body circumference just behind the scapula. One person was nominated to perform all the measurements to avoid individual errors.
Statistical analysis
Data analysis was performed using Statistical Analysis Software (SAS, 2009) package for program. Mean procedure was used for descriptive statistics, and REG procedure was used to examine the effect of each morphological trait on body weight. R studio software was used for Pearson correlation matrix to examine the relationship between body weight and morphological traits. The following regression model was performed:
Y = a + b1X1 + b2X2 + b3X3 + b4X4 + b5X5
Where; Y= dependent variable (body weight), a= regression intercept, b1– b5= coefficient of regression, X1- X5= independent variables (WH, RH. BL, RL, and HG).
Coefficient of determination (R2) and mean square error (MSE) were used to select the best fitted regression model.
Results and Discussion
Descriptive statistics of the studied traits
Boxplot (Figure 1) presented the summary of body weight distribution in does and bucks of South African non-descript indigenous goats. The summary showed the minimum 25th percentile (first quartile), median 75th percentile (third quartile) and maximum values of body weight among different sex of indigenous goats. Boxplot showed a significant difference in body weight between both sexes (P<0.05), respectively. Bucks showed a higher BW than does in all the parts of the boxplot including minimum (>20kg), first quartile, median (>30kg), third quartile (>40kg) and maximum (60kg). Descriptive statistics of the body weight and morphological traits of indigenous goats based on sex are presented in Table 1. Sexes had significant difference (P˂0.05) on all the morphological traits, with females (does) having higher recorded values as compared to the males (bucks).
Correlation
Phenotypic correlation matrix results are presented in Figure 2. Figure 2A shows phenotypic correlation coefficients between studied traits of does. Pearson correlation findings indicated that BW had a positive highly statistically correlation with WH (r = 0.70), RH (r = 0.40), BL (r = 0.54) but had a positive statistically correlation with HG (r = 0.26) while not correlation with RL (r = 0.08), respectively. These results also revealed that BL had a positive highly statistical correlation with all the measured traits (BW, r = 0.54; RL, r = 0.56; HG, r = 0.73; WH, r = 0.53; RH, r = 0.42). Figure 2B shows the correlation results of bucks. The results showed that RH had a positive highly statistical correlation with RL (r = 0.40), HG (r = 0.46), BW (r = 0.46), BL (r = 0.61) and WH (r = 0.63), respectively. HG had a positive highly correlation with only RL (r = 0.61) and RH (r = 0.46) while had no correlation with BW (r = 0.06), BL (r = 0.19) and WL (r = 0.16). The BW of bucks had a negative statistical correlation with RL (r = -0.26), positive statistical correlation with WH (r = 0.28), positive highly correlation with BL (r = 0.37) and had no correlation with HG (r = 0.06).
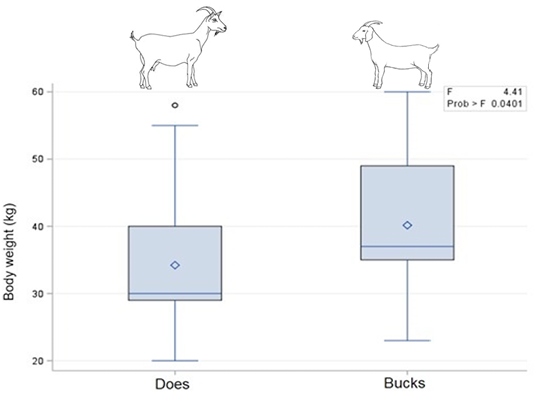
Figure 1: Boxplot demonstrating the median, minimum, maximum. 25th and 75th percentile values of body weight among different sex of South African indigenous goats.
Table 1: Descriptive statistics for body weight (kg) and body measurement traits (cm) of indigenous goats based on sex.
| Traits | Females (does) (n =80) | Males (bucks) (n=20) | ||
| Mean ± SE | CV (%) | Mean ± SE | CV (%) | |
| BW (kg) | 34.21±1.43 | 27.58 | 40.15±2.65 | 27.22 |
| WH (cm) | 62.63±1.44 | 15.15 | 64.82±2.31 | 14.67 |
| RH (cm) | 56.81±1.20 | 13.90 | 59.06±1.78 | 12.45 |
| BL (cm) | 70.90±1.35 | 12.45 | 73.79±1.89 | 10.56 |
| RL (cm) | 17.91±0.23 | 8.43 | 17.96±0.29 | 6.63 |
| HG (cm) | 81.06±1.42 | 11.47 | 80.67±1.54 | 7.89 |
SE: Standard error; CV: Coefficient of variance; BW: Body weight; WH: Withers height; RH: Rump height; BL: Body length; BD: Body depth; RW: Rump width; RL: Rump length; HG: Heart girth.
Effect of withers height on body weight
Simple linear regression analysis between body weight and withers height as shown in Table 2. In does, the results showed a positive highly statistical correlation between body weight and withers height (r = 0.70) with coefficient of determination (R2 = 0.49) and mean square error (MSE = 46.17). The results revealed that the withers height explained about 49% of variation in the body weight of does. The linear regression equation (Figure 3A) was established as follows:
BW = -8.66 + 0.69WH
Where;
BW= Body weight, WH= Withers height, -8.66 constant, 0.69 regression coefficient. The regression model indicated that by increasing one centimetres (1 cm) of withers height will increase body weight with 0.69 kilograms (kg). In bucks, the findings recognized a positive statistical correlation between body weight and withers height (r = 0.28) with R2 = 0.08) and mean square error (MSE = 102.96). These findings discovered that the withers height explained about 8% of variation in the body weight of bucks. The linear regression equation (Figure 3B) was established as follows:
BW = 19.62 + 0.31WH
Where;
BW = Body weight, WH = Withers height, 19.62 constant, 0.31 regression coefficient. The regression model indicated that by increasing 1 cm of withers height will increase body weight with 0.31 kilograms (kg) in bucks.
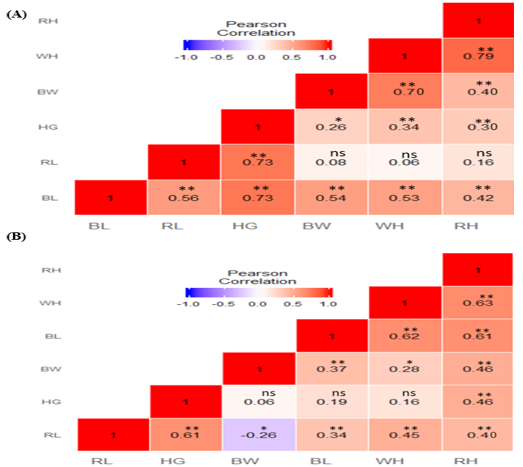
Figure 2: Heat map of phenotypic correlation of body weight and morphological traits of indigenous goats. (A) Correlation matrix of females (does); (B) Correlation matrix of males (bucks). Pearson correlation colour illustration, high correlation is red, mid correlation is white and low correlation is blue. BW: Body weight; WH: Withers height; RH: Rump height; BL: Body length; RL: Rump length; HG: Heart girth; ** Highly significant at p<0.01; * Significant at p<0.05; ns not significant.
Table 2: Regression analysis between body weight and withers height.
| Source | Sum of squares | DF | Mean square | R |
R2 |
Adjusted R2 |
| Does | ||||||
| Regression | 3444.01 | 1 | 3444.01 |
0.70** |
0.49 | 0.48 |
| Residual | 3601.33 | 78 | 46.17 | |||
| Total | 7045.34 | 79 | ||||
| Bucks | ||||||
| Regression | 162.63 | 1 | 162.63 | 0.28* | 0.08 | 0.03 |
| Residual | 1853.32 | 18 | 102.96 | |||
| Total | 2015.95 | 19 | ||||
R: Correlation coefficient; R2: Coefficient of determination; Adjusted R2: Adjusted coefficient of determination; DF: Degree of freedom; ** Significant at p<0.05; * Significant at p<0.01.
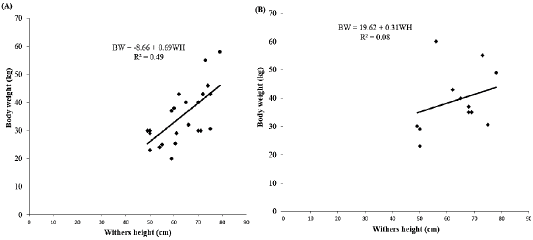
Figure 3: Effect of withers height on body weight. (A) Does and (B) Bucks. BW: Body weight; WH: Withers height; R2: Coefficient of determination.
Table 3: Regression analysis between body weight and body length.
| Source | Sum of squares | DF | Mean square | R |
R2 |
Adjusted R2 |
| Does | ||||||
| Regression | 2077.87 | 1 | 2077.87 | 0.54** | 0.30 | 0.29 |
| Residual | 4967.47 | 78 | 63.69 | |||
| Total | 7045.34 | 79 | ||||
| Bucks | ||||||
| Regression | 270.70 | 1 | 270.70 | 0.37** | 0.13 | 0.09 |
| Residual | 1745.25 | 18 | 96.96 | |||
| Total | 2015.95 | 19 | ||||
R: Correlation coefficient; R2: Coefficient of determination; Adjusted R2: Adjusted coefficient of determination; DF: Degree of freedom; ** Significant at p<0.01.
Effect of body length on body weight
Simple linear regression analysis between body weight and body length as shown in Table 3. In does, the findings showed a positive highly statistical correlation between body weight and withers height (r = 0.54) with R2 = 0.30 and MSE= 63.69. The results revealed that the withers height explained about 30% of variation in the body weight of does. The linear regression equation (Figure 4A) was established as follows:
BW = -7.02 + 0.58BL
Where;
BW= Body weight, BL= Body length, -7.02 constant, 0.58 regression coefficient. The regression model indicated that by increasing 1 cm of body length will increase body weight with 0.58kg. In bucks, the findings recognized a positive highly statistical correlation between body weight and body length (r = 0.37) with R2 = 0.13 and MSE = 96.96. These findings discovered that the body length explained about 13% of variation in the body weight of bucks. The linear regression equation (Figure 4B) was established as follows:
BW = 4.09 + 0.48BL
Where;
BW= Body weight, BL= Body length, 4.09 constant, 0.48 regression coefficient. The regression model indicated that by increasing 1 cm of body length will increase body weight with 0.48kg in bucks.
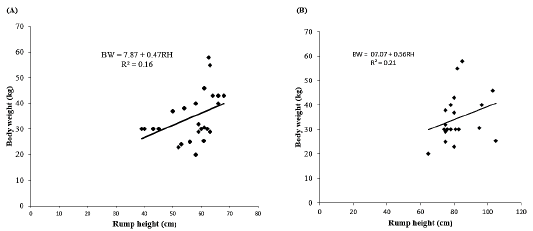
Figure 4: Effect of body length on body weight. (A) Does and (B) Bucks. BW: Body weight; BL: Body length; R2: Coefficient of determination.
Table 4: Regression analysis between body weight and rump height.
| Source | Sum of squares | DF | Mean square | R |
R2 |
Adjusted R2 |
| Does | ||||||
| Regression | 1123.57 | 1 | 1123.57 | 0.40** | 0.16 | 0.15 |
| Residual | 5921.76 | 78 | 75.92 | |||
| Total | 7045.34 | 79 | ||||
| Bucks | ||||||
| Regression | 423.99 | 1 | 423.99 | 0.46** | 0.21 | 0.17 |
| Residual | 1591.96 | 18 | 88.44 | |||
| Total | 2015.95 | 19 | ||||
R: Correlation coefficient; R2: Coefficient of determination; Adjusted R2: Adjusted coefficient of determination; DF: Degree of freedom; ** Significant at p<0.01.
Effect of rump height on body weight
Simple linear regression analysis between body weight and rump height as shown in Table 4. The regression findings indicated that there was a positive and linear relationship between body weight and rump weight. In does, the results revealed a positive highly statistical correlation between body weight and rump height (r = 0.40) with R2 = 0.16 and MSE = 75.92. The results revealed that the rump height explained about 16% of variation in the body weight of does. The linear regression equation (Figure 5A) was established as follows:
BW = 7.87 + 0.47RH
Where;
BW= Body weight, RH= rump height, 7.87 constant, 0.47 regression coefficient. The regression model indicated that by increasing 1 cm of rump height will increase body weight with 0.47kg. In bucks, the findings recognized a positive highly statistical correlation between body weight and rump height (r = 0.46) with R2 = 0.21 and MSE = 88.44. These findings revealed that the rump height explained about 21% of variation in the body weight of bucks. The linear regression equation (Figure 5B) was established as follows:
BW = 07.07 + 0.56RH
Where;
BW= Body weight, RH= Rump height, 07.07 constant, 0.56 regression coefficient. The regression model indicated that by increasing of 1 cm of rump height will increase body weight with 0.56kg in bucks.
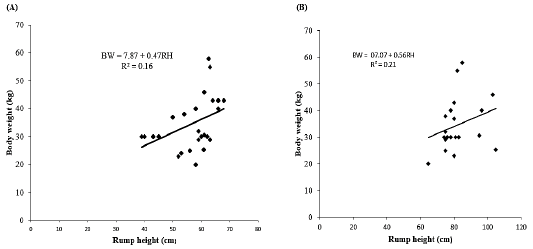
Figure 5: Effect of rump height on body weight. (A) Does and (B) Bucks. BW: Body weight; RH: Rump height; R2: Coefficient of determination.
Effect of rump length on body weight
Simple linear regression analysis between body weight and withers height as shown in Table 5. In does, the findings showed a non-statistical correlation between body weight and rump length (r = 0.08) with R2 = 0.01 and MSE= 89.71. The results indicated that the rump length explained about 1% of variation in the body weight of does. The linear regression equation (Figure 6A) was established as follows:
BW = 25.28 + 0.52RL
Where;
BW= Body weight, RL= Rump length, 25.28 constant, 0.52 regression coefficient. The regression model showed that by increasing 1 cm of rump length will increase body weight with 0.52kg. In bucks, the results indicated a positive statistical correlation between body weight and rump length (r = 0.26) with R2 = 0.07) and MSE = 104.58. These findings discovered that the rump length explained about 7% of variation in the body weight of bucks. The linear regression equation (Figure 6B) was developed as follows:
BW = 80.30 – 2.27RL
Where;
BW = Body weight, RL = Rump length, 80.30 constant, -2.27 regression coefficient. The regression model indicated that by increasing 1 cm of rump length will decrease body weight with 2.27kg in bucks.
Table 5: Regression analysis between body weight and rump length.
| Source | Sum of squares | DF | Mean square | R |
R2 |
Adjusted R2 |
| Does | ||||||
| Regression | 48.02 | 1 | 48.02 |
0.08ns |
0.01 | -0.01 |
| Residual | 6997.32 | 78 | 89.71 | |||
| Total | 7045.34 | 79 | ||||
| Bucks | ||||||
| Regression | 133.55 | 1 | 133.55 | 0.26* | 0.07 | 0.01 |
| Residual | 1882.40 | 18 | 104.58 | |||
| Total | 2015.95 | 19 | ||||
R: Correlation coefficient; R2: Coefficient of determination; Adjusted R2: Adjusted coefficient of determination; DF: Degree of freedom; * Significant at p<0.05; ns not significant.
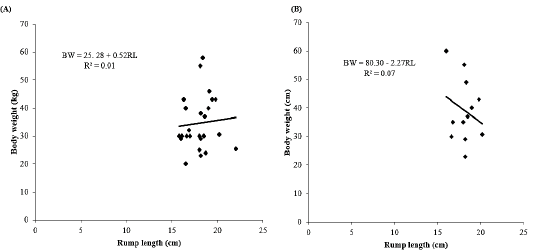
Figure 6: Effect of rump length on body weight. (A) Does and (B) Bucks. BW: Body weight; RL: Rump length; R2: Coefficient of determination.
Effect of heart girth on body weight
Simple linear regression analysis between body weight and withers height as shown in Table 6. The regression findings indicated that there was a positive and linear relationship between body weight and heart girth. In does, the results showed a positive statistical correlation between body weight and heart girth (r = 0.26) with R2 = 0.07) and MSE = 84.02. The results showed that the heart girth explained about 7% of variation in the body weight of does. The linear regression equation (Figure 7A) was established as follows:
BW = 12.81 + 0.27HG
Where;
BW= Body weight, HG= Heart girth, 12.81 constant, 0.27 regression coefficient. The regression model indicated that by increasing 1 cm of heart girth will increase body weight with 0.27kg. In bucks, the findings recognized a non-statistical correlation between body weight and withers height (r = 0.06) with R2= 0.00 and MSE= 111.65. These findings discovered that the heart girth does not explained any percent in the variation of body weight of bucks. The linear regression equation (Figure 7B) was established as follows:
BW = 32.87 + 0.08HG
Where;
BW= Body weight, HG= Heart girth, 32.87 constant, 0.08 regression coefficient.
Table 6: Regression analysis between body weight and heart girth
| Source | Sum of squares | DF | Mean square | R |
R2 |
Adjusted R2 |
| Does | ||||||
| Regression | 491.47 | 1 | 491.47 | 0.26** | 0.07 | 0.06 |
| Residual | 6553.87 | 78 | 84.02 | |||
| Total | 7045.34 | 79 | ||||
| Bucks | ||||||
| Regression | 6.26 | 1 | 6.26 |
0.06ns |
0.00 | -0.05 |
| Residual | 2009.70 | 18 | 111.65 | |||
| Total | 2015.95 | 19 | ||||
R: Correlation coefficient; R2: Coefficient of determination; Adjusted R2: Adjusted coefficient of determination; DF: Degree of freedom; **Significant at p<0.05; ns not significant.
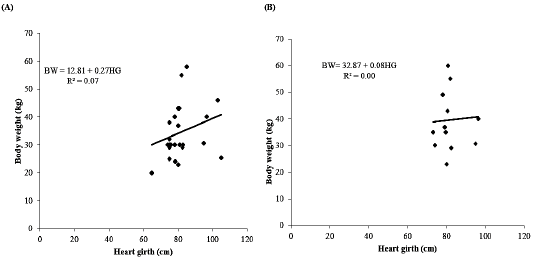
Figure 7: Effect of heart girth on body weight. (A) Does and (B) Bucks. BW: Body weight; HG: Heart girth; R2: Coefficient of determination.
Non-descript indigenous goats in South Africa are raised as a source of hides, meat, milk and traditional ceremonies (Webb et al., 2003). Kotze et al. (2014) indicated that non-descript indigenous goats population is increasing day by day due to uncontrolled breeding of goat breeds. Indigenous goats play a vital role in the livelihood of rural people by providing mainly milk, meat and cash income (Sen et al., 2020). The current study focused on investigating the relationship between body weight and some of the morphological traits of indigenous goats using correlation technique. The data for the current study was summarised for descriptive statistics for both sexes. The results showed that females (does) had a higher mean values than males (bucks) (P<0.05) in most studied traits. The summary suggests that sexual dimorphism was in favour of females (does) than males (bucks). Differences might be attributed to the different sex hormones present during growth periods of indigenous goats. Similar findings were found by Yakubu and Mohammed (2012) on Red Sokoto goats of Nigeria. However, Norris et al. (2015) indicated that males were higher than females in all the measured traits except body length and heart girth. We firstly examined the relationship between body weight and morphological traits (withers height, body length, rump length, rump height and heart girth) by correlation technique. In does, correlation results revealed that body weight had a positive statistically correlation with withers height, rump height, body length and heart girth but not statistically correlated with rump length. These results suggest that by increasing withers height, rump height, body length and heart girth of does might also increase the body weight. Consequently, withers height, rump height, body length and heart girth might be used as a selection criterion during breeding to improve body weight in does. In bucks, correlation findings recognized that rump height had a positive highly statistical correlation with rump length, heart girth, body weight, body length and withers height. These findings recommend that by increasing rump length, heart girth, body weight, body length and withers height of bucks may also increase the body weight. Thus, rump length, heart girth, body weight, body length and withers height might be used as a selection criterion during breeding to improve body weight in bucks. Our findings are in agreement with the results of Slippers et al. (2000) and Mahieu et al. (2011). The current study was also focusing on investigating the effect of withers height, body length, rump length, rump height and heart girth on body weight in both sexes by simple regression. Coefficient of determination and mean square residual (mean square error) were employed to determine the best fitting regression equation. In does, withers height had the highest coefficient of determination and low mean square error followed by body length. Therefore, these results suggest that withers height and body length had a higher contribution in the body weight of does as compare with other studied morphological traits. In bucks, rump height had the highest coefficient of determination and low mean square error followed by body length. Thus, findings suggest that rump height and body length had a highest contribution in the body weight of bucks.
In conclusion, the current study recognized that there is a sex effect on descriptive statistics. Pearson correlation results suggest that there is an association between body weight and withers height, body length, rump length, rump height and heart girth of South African non-descript indigenous goats. In does, withers height, rump height, body length and heart girth had a statistical remarkably correlation with body weight. In bucks, rump length, heart girth, body weight, body length and withers height had a statistical significant correlation with rump height. Simple regression was also performed to examine the effect of morphological traits on body weight. Regression results indicated that withers height and rump height play a great contribution in the body weight of does and bucks. The results of the current study might help the indigenous goats’ farmers and researchers to understand the relationship between body weight and morphological traits. This study might also help goats’ farmers during selection to improve body weight in breeding. Further studies need to be conducted in association between morphological traits and body weight in bigger sample size of the same or different goat breeds.
Acknowledgements
Authors wish to express their appreciation to the University of Limpopo Experimental Farmworkers for their support during data collection and Department of Agricultural Economics and Animal Production, the University of Limpopo for financial support.
Author Contributions
TLT designed the experiment, analysed the data and wrote the manuscript. KMM, KM, TLR, MCM, LWD, KMM, PMB, NDM and DM performed fieldwork and wrote the manuscript. MCM and KM reviewed the manuscript. TLT and TLR read, edited and approved the final manuscript.
Conflicts of interest
The Authors have declared no conflict of interest.
References


