Journal of Animal Health and Production
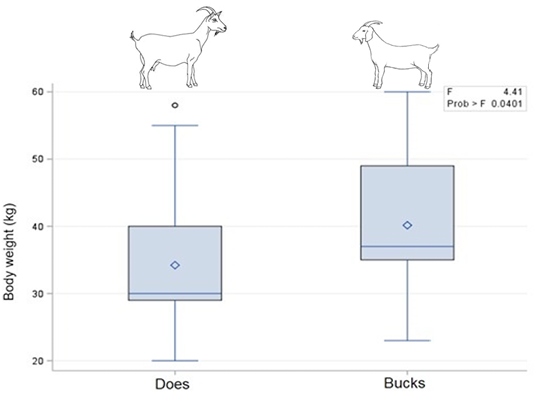
Boxplot demonstrating the median, minimum, maximum. 25th and 75th percentile values of body weight among different sex of South African indigenous goats.
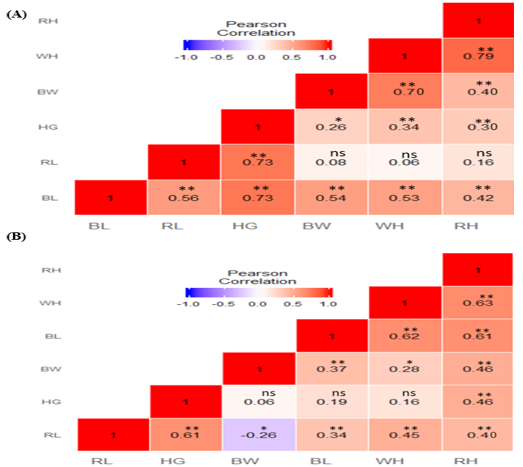
Heat map of phenotypic correlation of body weight and morphological traits of indigenous goats. (A) Correlation matrix of females (does); (B) Correlation matrix of males (bucks). Pearson correlation colour illustration, high correlation is red, mid correlation is white and low correlation is blue. BW: Body weight; WH: Withers height; RH: Rump height; BL: Body length; RL: Rump length; HG: Heart girth; ** Highly significant at p<0.01; * Significant at p<0.05; ns not significant.
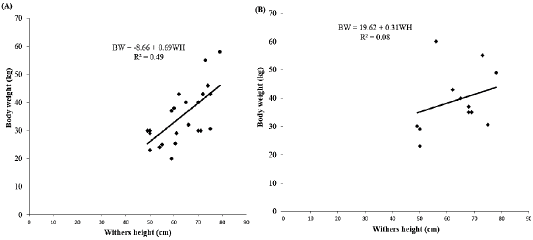
Effect of withers height on body weight. (A) Does and (B) Bucks. BW: Body weight; WH: Withers height; R2: Coefficient of determination.
Effect of body length on body weight. (A) Does and (B) Bucks. BW: Body weight; BL: Body length; R2: Coefficient of determination.
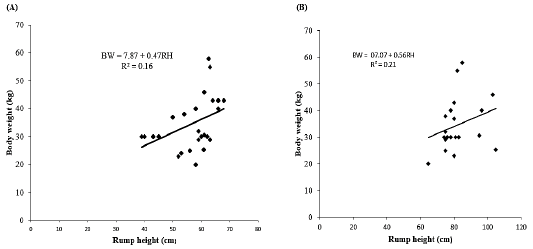
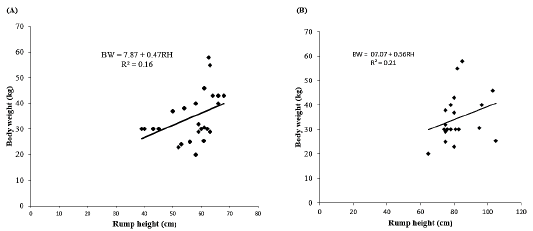
Effect of rump height on body weight. (A) Does and (B) Bucks. BW: Body weight; RH: Rump height; R2: Coefficient of determination.
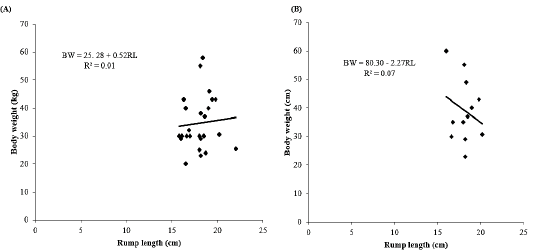
Effect of rump length on body weight. (A) Does and (B) Bucks. BW: Body weight; RL: Rump length; R2: Coefficient of determination.
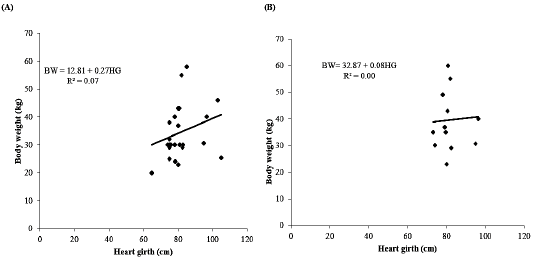
Effect of heart girth on body weight. (A) Does and (B) Bucks. BW: Body weight; HG: Heart girth; R2: Coefficient of determination.


