Journal of Animal Health and Production
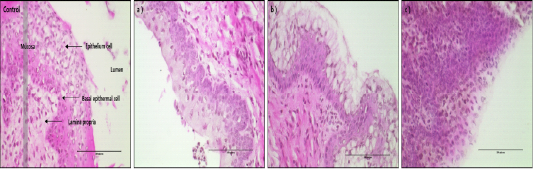
H&E-stained vaginal tissues after 24hr of treatment with D1, D2 and D3 (magnification, X400). Black bar=100 um. Control group: Normal vaginal epithelium cell of mice, a) D1 treatment group, b) D2 treatment group, c) D3 treatment group.
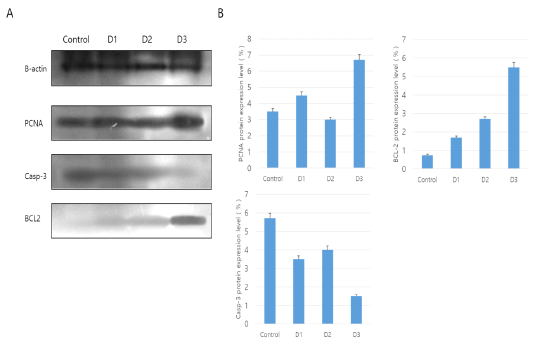
Western blot analysis for PCNA, BCL-2 and Caspase-3 (Casp-3) in vaginal tissue. The mean ± SEM of the treatment groups were normalized according to β-actin (Housekeeping gene) as a standard. A: Western blot analysis, B: Use of Image J program in NIH(Schneider et al.,, 2012).
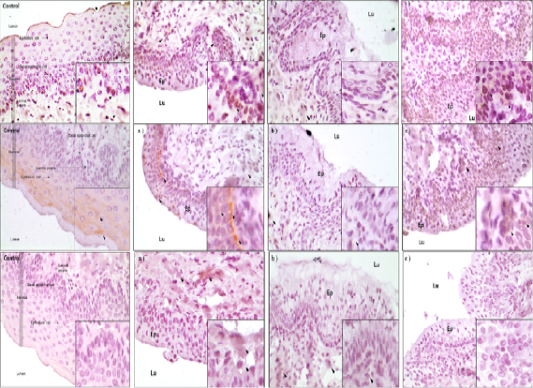
A) IHC analysis of PCNA protein in the vaginal tissue of mice. Black arrows is the protein detected point (magnification X400 in a small box and magnification X100 in a large box). a) D1 treatment group, b) D2 treatment group, c) D3 treatment group. Ep: Epithelium cell well, Lu: Lumen zone; B) IHC analysis of BCL-2 protein in the vaginal tissue of mice. Black arrows is the protein detected point (magnification X400 in a small box and magnification X100 in a large box). a) D1 treatment group, b) D2 treatment group, c) D3 treatment group. Ep: Epithelium cell well, Lu: Lumen zone; C) IHC analysis of BCL-2 protein in the vaginal tissue of mice. Black arrows is the protein detected point (magnification X400 in a small box and magnification X100 in a large box). a) D1 treatment group, b) D2 treatment group, c) D3 treatment group. Ep: Epithelium cell well, Lu: Lumen zone.
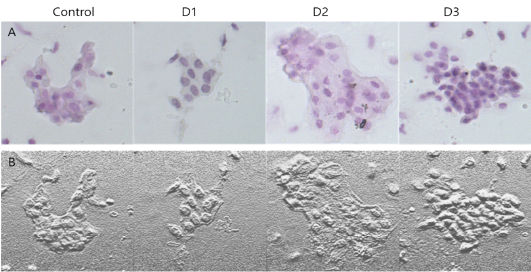
A: H&E staining of mouse vagina epithelial cells treated with D1, D2 and D3. B: Microscopic image analysis of mouse vagina epithelial cells for different treatment groups.


