Journal of Animal Health and Production
Research Article

Effect of Feeding of Moringa oleifera Seed Meal as a New Protein Source on Performance, Digestibility and Blood Constituents of Male Goats Under Desert Conditions
Hashem H. Abdel-Rahman1, Sobhy Abdel-Shafy2*, Soad M. Nasr2, Yasser A.A. El-Nomeary1, Tamer H. Abd El-Aziz2, Mohsen M. Shoukry1, Aboelfetoh M. Abdalla3, Mamdouh I. Mohamed1
1Department of Animal Production, Agricultural and Biological Research Division, National Research Centre, 33 Bohouth St., Dokki, 12622 Giza, Egypt; 2Department of Parasitology and Animal Diseases, Veterinary Research Division, National Research Centre, 33 Bohouth St., Dokki, 12622 Giza, Egypt; 3Horticulture and Crops Technology, Agricultural and Biological Research Division, National Research Centre, 33 Bohouth St., Dokki, 12622 Giza, Egypt.
Abstract | This experiment aimed to evaluate the effect of feeding different levels of Moringa oleifera seed meal (MOSM) as a potential protein source instead protein of cotton seed meal (CSM) on nutrients digestibility, feeding value and hemato-biochemical parameters of male Damascus goats. Fifteen clinically healthy male goats were assigned randomly into three equal groups (G1, G2 and G3). G1 fed control ration (R1) contained 100% CSM. G2 and G3 received trial rations (R2 & R3) contained 25% and 50% of MOSM instead protein of CSM. Feeding and watering were given freely throughout this study. The feeding trial lasted for eight weeks. The chemical composition, amino acids, digestibility coefficient and nutritive values were determined in MOSM. Blood samples were collected and analyzed for hematological and biochemical parameters. Results revealed that the crude protein and ether extract contents in MOSM was higher than CSM (30.04% and 13.66% vs. 26.24 and 8.39%, respectively). The amino acids were higher in MOSM than CSM. The animals fed ration R3 contained 50% MOSM had significant (P<0.01) increase in all nutrients digestibility and nutritive value in terms of total digestible nutrients (TDN) and digestible crude protein (DCP) values. The intake of TDN and DCP in terms as g/kg w0.75 and kg/100kg BW were significantly increased (P<0.01) for animals fed R3. The relative economic efficiency improved by 485.50% and 153.81% for R3 and R2 vs R1 (100%). Red blood cells count was increased with lowering in mean corpuscular volume (MCV), mean corpuscular hemoglobin (MCH), while leukocytes and lymphocytes were increased, however, neutrophils count was decreased in G2 and G3. Serum aspartate aminotransferase (AST) and alanine aminotransferase (ALT) activities, and triglycerides, total cholesterol as well as glucose levels exhibited gradual decrease while total proteins and globulins were markedly (P<0.05) increased in G2 and G3. In conclusion, goats could depend on MOSM as protein source which improved the cellular immunity, liver and kidney functions without any serious effect on economic cost.
Keywords | Goats, Moringa oleifera seed meal, Amino acids, Nutritive values, Hemogram, Serum biochemistry.
Received | June 20, 2019; Accepted | September 02, 2019; Published | November 07, 2019
*Correspondence | Sobhy Abdel-Shafy, Department of Parasitology and Animal Diseases, National Research Centre, 33 Bohouth Street, Dokki, Post Box, 12622, Giza, Egypt; Email: aasobhy@yahoo.com
Citation | Abdel-Rahman HH, Abdel-Shafy S, Nasr SM, El-Nomeary YAA, Abd El-Aziz TH, Shoukry MM, Abdalla AM, Mohamed MI (2019). Effect of feeding of moringa oleifera seed meal as a new protein source on performance, digestibility and blood constituents of male goats under desert conditions. J. Anim. Health Prod. 7(4): 131-141.
DOI | http://dx.doi.org/10.17582/journal.jahp/2019/7.4.131.141
ISSN | 2308-2801
Copyright © 2019 Abdel-Shafy et al. This is an open access article distributed under the Creative Commons Attribution License, which permits unrestricted use, distribution, and reproduction in any medium, provided the original work is properly cited.
INTRODUCTION
Moringa oleifera Lam (MO) (Moringaceae), is a multinutrient plant that have multiple medicinal uses and called the miracle tree. It is native to India and is distributed and cultivated all over the world throughout the semi-arid tropics, tropics and subtropics countries (Raman et al., 2018). This plant grows in arid and coastal regions and can resists drought and light frost. Nowadays, it is cultivated in arid regions as a nutritional crop for the rural population (Sanchez-Machado et al., 2010).
Moringa oleifera leaves, pods and seeds contained good quality protein, important minerals (potassium, calcium, copper and iron) and vitamins (vit. C, vit. A (Beta- carotene)), amino acids and fatty acids like linoleic, linolenic, and behenic acid (Maizuwo et al., 2017). It contains large amounts of various phytochemicals including phenolics, tannins, saponin, glucosinolates, flavonoids, flavonol glycosides, quercetin, kaempferol, phytate, and lectins (Maizuwo et al., 2017; Atta et al., 2017; 2018; 2019). These phytochemicals help in treating various diseases as antidiarrheal, antiulcerative, and hepato- and nephroprotective, antidiabetic and anticancer effects (Gopalakrishnan et al., 2016; Shalaby et al., 2016; Atta et al., 2017, 2018; Villarruel-López et al., 2018; Hagoel et al., 2019). All parts of MO tree are edible. The mature seed contains about 40% edible oil, seeds after oil extraction could be used as a feed supplement to livestock.
Moringa oleifera seed meal (MOSM) contains high quality proteins (Folkard et al., 2001). MOSM also could improve rumen fermentation (Ben Salem and Makkar, 2009). The proteins in MOSM could decline degradability of feed proteins in rumen system and enhance the post ruminal protein supply (Makkar et al., 2007). The most plant secondary metabolites were absent in MOSM whereas, glucosinolates was found (Makkar and Becker, 1997). MOSM possess phytoconstituents with useful antinutrient properties (Idoko et al., 2017). Moringa oleifera seed is proven to have antioxidant, anti-inflammatory and anti-ulcerative properties (Emmanuel, 2016; Atta et al., 2019).
Current study was designed to assess the effect of mixing 25% and 50% of MOSM instead of the cotton seed meal as a new source of protein on nutrients digestibility, feeding value, growth performance and economic efficiency of male Damascus goats. Hemogram and serum biochemical profiles related to liver and kidney functions were also evaluated.
MATERIALS AND METHODS
The present research was carried out at the Beer Abo Kalam in El-Tour City, Southern Sinai Governorate and at the Laboratories of Animal Production and Parasitology and Animal Diseases Departments, NRC, Dokki, Giza, Egypt.
Ethics Statement
This experiment was conducted according to the guidelines of the Institutional Committee, National Research Centre, Giza, Egypt and the Approval Protocol Number was 19/015.
Moringa oleifera Seed Meal
MOSM was donated by the Egyptian Scientific Society of Moringa, National Research Centre, Dokki, Giza, Egypt. Defatted Moringa oleifera seed meal was prepared using the non-solvent mechanical cold press method according to the method of Fils (2000).
Chemical Composition of the Experimental Rations
Moringa seed meal, cotton seed meal and each experimental diet were analyzed to estimate dry matter (DM), organic matter (OM), crude protein (CP), crude fiber (CF), ether extract (EE) and ash contents according to the standard methods of AOAC (1995). Carbohydrates (nitrogen free extract; NFE) were also estimated.
Amino acids content was estimated according to the method of Spackman et al. (1958) and Moore et al. (1958). The amino acids were determined by using LC3000 amino acid analyzer (Eppendorf-Biotronik, Germany), NRC, Egypt.
General Layout of Experiment
Fifteen clinically healthy male Damascus goats (aged 1 to 2 years, initial weight 48.15 to 48.75 kg) were used in this experiment. Feed and water were offered ad libitum. Goats were divided into three equal groups (5 animals each). The first group was offered control ration (R1) consisting of 40% yellow corn grains, 30% cotton seed meal (CSM), 17% wheat bran, 10% bean straw, 2% limestone and 1.0% salt. The second and the third groups fed experimental rations (R2) and (R3) contained 25% and 50% of MOSM instead of CSM as a source of protein, respectively.
Table 1 shows the formulation and the chemical composition of the experimental rations and their ingredients. The feed mixture (3% goat body weight) was fed twice daily, one at 8.0 a.m. and another at 4.0 p.m. The fresh water was available to animals all the time. Nutrients digestibility, feeding value and growth performance were investigated. During eight weeks trial, animals’ body weight and feed intake were recorded weekly and the feed intake was adjusted for each animal. Male goats were weekly weighted up to the 8th week in all groups. The daily body weight gain, the amount of feed consumed per goat and the feeding conversion were calculated.
Blood Samples
Blood samples were taken from jugular vein from all groups for hematological and biochemical parameters before treatment (zero time) and every two weeks for eight weeks (at 2nd, 4th, 6th and 8th week of the experiment). The first sample was collected into a vacutainer tube with anticoagulant EDTA-K3 (ethylenediaminetetraacetic acid tripotassium) for hematological investigations. The second blood sample was collected into a plain vacutainer tubes for sera separation. The sera were stored at −20 °C for biochemical analysis.
Hematological Examination
Complete blood picture was performed on blood samples of goats using a hematological analyzer (Exigo Vet, Sweden). The analysis included erythrogram; red blood cell count (RBC), hematocrit (HCT), hemoglobin (Hb) concentration and red cell indices; mean corpuscular volume (MCV), mean corpuscular hemoglobin concentration (MCHC), leukogram: white blood cell count (WBC), differential leukocytes (lymphocytes, monocytes, neutrophils, eosinophils and basophils).
Serum Biochemical Analysis
Total proteins (Henary et al., 1974), albumin (Doumas et al., 1971), activities of alanine aminotransferase (ALT), aspartate aminotransferase (AST) (Reitman and Frankel, 1957), gamma glutamyl transferase (GGT) (Schiele et al., 1977), glucose (Trinder, 1969), total cholesterol (Allain et al., 1974), triglycerides (Fossati and Prencipe, 1982), blood urea nitrogen (Patton and Crouch, 1977) and creatinine (Houot,1985) were determined using commercial test kits according to the manufactures’ instruction and Spectrophotometer (T80 UV/VIS PG instrument Ltd, UK). The used test kits were purchased from bioMérieux, France. Total globulin was calculated by subtracting the obtained albumin value from the total protein.
Economic Evaluation of the Experimental Rations
Economic efficiency was represented by daily profit over feed cost. The costs were based on average values of year 2015 for feeds and live body weight.
Statistical Analysis
Collected data were expressed as mean and standard errors (Mean± SE). Statistical analysis was performed between the control and treated groups using a one-way analysis of variance followed by Duncan’s multiple range test (Snedecor and Cochran, 1989).
Data of nutrition were analyzed using the following mathematical model: Yij = u + + Ti + eij where: Yij is the parameter under analysis, u is the overall mean, Ti is the effect due to treatment and eij is experimental error. The general linear model of SAS (2009) program was used in processing measured parameters.
However, data of hematology and biochemical were analyzed using a one-way analysis of variance followed by Duncan’s multiple range test using SPSS software version 17 computer program.
RESULTS
Chemical Composition of the Experimental Diets
Table 1 shows chemical analysis of the tested rations, MOSM and CSM. The results showed that the crude protein (CP) and ether extract (EE) contents in MOSM were higher (30.04% and 13.66%, respectively) in comparison with the CSM (26.24% and 8.39%, respectively).
Amino Acids Profile
On dry matter basis, the total amino acids level was higher in MOSM (57.03 g/100 g, ranged from 0.68 to 11.79 g/100 g) than CSM (31.70 g/100g, ranged from 0.24 to 6.68 g/100 g). Moreover, the total essential amino acids content were double in the MOSM (25.20 g/100 g) than that in the CSM (13.37 g/100 g). The total non-essential amino acids content were double in the MOSM (31.83 g/100 g) than in the CSM (18.33 g/100 g). Generally, all the essential and non-essential amino acids were higher in MOSM than that in the CSM (Table 2).
Feed Intake
Effect of experimental rations containing 25 and 50% of MOSM and 100% CSM on daily dry matter and nutrients intake in goats are illustrated in Table 3. Feed intake revealed that the total digestible nutrients intake (TDN) and digestible crude protein (DCP) as kg or g/kg w0.75 and kg or g/100 kg BW, were markedly (P<0.05) higher in G2 fed R2 (25% MOSM) and G3 fed R3 (50% MOSM) than the control group (G1). But TDM and DCP in G3 markedly increased than in G2. However, there was no statistical difference in the total DM intake as kg/day, g/kg w 0.75 and kg/100 kg BW between all treated groups. The increasing intake of TDN and DCP for group fed ration 3 than the other groups may be due to increasing in all nutrients digestibility.
The total digestible nutrients intake (TDN) and digestible crude protein (DCP) as kg or g/kg w0.75 and kg or g/100 kg BW for G3 fed R3 contained 50% MOSM were higher significantly (P< 0.05) than both other groups. In addition, TDN intake as kg/100 kg BW and DCP intake as g/kg w0.75 and g/100 kg BW were significant (P< 0.05) higher in group fed R2 than group fed R1. However, there was no statistical difference in the total dry matter intake as kg/day, g/kg w0.75 and kg/100 kg BW between all treated groups.
Digestibility Coefficients, Nutritive Value, Growth Performance and Feed Conversion
The results of nutrient digestibility coefficients, nutritive values, growth performance and feed conversion of the experimental rations are shown in Table 4.
Table 1: Feed ingredients (%) and chemical composition of the experimental rations (R) and two sources of protein (on dry matter basis).
| R1 | R2 | R3 | MOSM | CSM | |
| Ingredients: | |||||
| Yellow corn grains | 40 | 40 | 40 | ||
| Cotton seed meal | 30 | 22.5 | 15 | ||
| Moringa seed meal | 0 | 7.5 | 15 | ||
| Wheat bran | 17 | 17 | 17 | ||
| Bean straw | 10 | 10 | 10 | ||
| Limestone | 2 | 2 | 2 | ||
| Salt | 1 | 1 | 1 | ||
| Dry matter | 88.25 | 89.04 | 88.62 | 89.21 | 90.38 |
|
Chemical composition (%) on DM basis: |
|||||
| Organic matter | 92.01 | 91.30 | 91.01 | 94.29 | 94.49 |
| Crude protein | 12.25 | 12.58 | 12.89 | 30.04 | 26.24 |
| Crude fibre | 21.73 | 22.04 | 22.41 | 30.81 | 29.92 |
| Ether Extract | 2.13 | 3.48 | 3.98 | 13.66 | 8.39 |
| Nitrogen free extract | 55.92 | 53.20 | 53.71 | 19.78 | 29.94 |
| Ash | 7.97 | 8.70 | 7.01 | 5.71 |
5.51 |
MOSM: Moringa oleifera seed meal; CSM: cotton seed meal.
R1: Control ration contained 100% of CSM -as a source of protein.
R2: Trial ration contained 25% of MOSM instead of CSM -as a source of protein.
R3: Trial ration contained 50% of MOSM instead of CSM -as a source of protein.
Table 2: Amino acids composition of Moringa oleifera seed meal (MOSM) and cotton seed meal (CSM) (g/100g on dry matter basis).
| Essential amino acids | Non-essential amino acids | ||||
| MOSM | CSM | MOSM | CSM | ||
| Threonine | 1.81 | 1.07 | Arginine | 2.86 | 1.75 |
| Valine | 2.59 | 1.63 | Proline | 1.80 | 1.11 |
| Methionine | 0.68 | 0.24 | Aspartic acid | 4.83 | 2.62 |
| Isoleucine | 2.05 | 1.02 | Serine | 2.70 | 1.47 |
| Leucine | 5.88 | 3.01 | Glutamic acid | 11.79 | 6.68 |
| Phenylalanine | 5.42 | 2.97 | Glycine | 1.09 | 0.72 |
| Histidine | 2.32 | 1.25 | Alanine | 4.01 | 2.88 |
| Lysine | 4.45 | 2.18 | Tyrosine | 2.75 | 1.10 |
| Total | 25.20 | 13.37 | 31.83 |
18.33 |
|
The digestion coefficients of DM, OM, CP, CF, EE, and NFE were significantly (P< 0.05) higher for animals fed R3 (50% MOSM) than animals fed R2 (25% MOSM) and R1 (100% CSM). The improvements in all nutrients digestibility reflected on the nutritive values expressed as TDN or DCP, where there were significantly (P<0.05) higher for group fed R3 than the values of other two groups (R1 & R2).
Results of growth performance revealed that there was no significant difference in daily gain in weight for goats fed the three diets, while the goats receiving R3 recorded the highest value of average daily gain (112.5 g/h/d). The present study indicated that incorporation of MOSM at 50% of CSM show an improvement in growth rate compared with the other groups.
The average daily gain for goats fed MOSM at 50% of CSM was 112.50 g//h/d, followed by (R2) and (R1) which were 83.33 and 79.17 g/h/d, respectively. This result might be attributed to the high TDN and DCP intake.
The results for feed conversion as kg DM, kg TDN and kg DCP intakes /kg gain indicated that the best feed conversion value obtained for R3 (12.97 for DM) compared to R2 and R1 (17.55 and 18.24, respectively). The same trend
Table 3: Body weight, feed intake, total digestible nutrients and digestible crude protein intake of male goats fed experimental rations containing different levels of moringa seed meal.
| Item | Experimental rations | SE | ||
| R1 | R2 | R3 | ||
| Average body weight (kg) | 48.13 | 48.75 | 48.63 | |
| Metabolic body size | 18.27 | 18.45 | 18.41 | |
| Total DM intake (kg ration/day) | 1.44 | 1.46 | 1.46 | |
|
Feed intake: Dry matter (kg/day) |
1.44 |
1.46 |
1.46 |
± 0.04 |
|
g/kg w 0.75 |
78.90 | 79.37 | 79.24 |
± 0.47 |
| kg/100 kg BW | 3.00 | 3.00 | 3.00 | |
| Total digestible nutrients (TDN): | ||||
| kg/day | 0.85 | 0.86 |
0.98 |
± 0.03 |
|
g/kg w 0.75 |
46.62b |
46.09b |
53.06a |
± 0.96 |
| kg/100kg BW |
1.78c |
1.76b |
2.00a |
± 0.03 |
| Digestible crude protein (DCP): | ||||
| g/ day | 109.05 | 119.25 | 126.29 |
± 0.00 |
|
g/kg w 0.75 |
5.97c |
6.46b |
6.85a |
± 0.00 |
| g/100kg BW |
226.59c |
244.63b |
259.73a |
± 0.04 |
Means with different letters in the same row are significantly different at P<0.05.
Table 4: Digestibility coefficients, nutritive value, growth performance and feed conversion of male goats fed the experimental rations (N=5).
| Item | Experimental rations | SE | ||
| R1 | R2 | R3 | ||
| Nutrients digestibility (%): | ||||
| Dry matter (DM) |
60.78b |
61.11b |
65.07a |
± 0.75 |
| Organic matter (OM) |
63.67b |
62.37b |
67.54a |
± 1.04 |
| Crude protein (CP) |
63.29b |
64.65ab |
68.79a |
± 1.41 |
| Crude fibre (CF) |
52.21b |
52.06b |
59.43a |
± 1.32 |
| Ether extract (EE) |
64.22b |
65.72b |
71.50a |
± 1.21 |
| Nitrogen free extract (NFE) |
62.97b |
63.41b |
71.67a |
± 1.53 |
| Nutritive values (%): | ||||
| Total digestible nutrients (TDN) |
59.19b |
58.80b |
66.96a |
± 1.37 |
| Digestible crude protein (DCP) |
7.56b |
8.14a |
8.65a |
± 0.18 |
|
Body weight (kg): |
||||
| Initial | 45.75 | 46.25 | 45.25 |
±1.21 |
| Final | 50.50 | 51.25 | 52.00 |
±1.14 |
|
Gain |
4.75 | 5.00 | 6.75 |
±0.45 |
| Average body weight gain (g/head/day) | 79.17 | 83.33 | 112.50 | |
| Feed intake (g/head/day) | ||||
| DM | 1443.75 | 1462.50 |
1458.75 |
±34.48 |
| TDN | 854 | 862 | 978 |
±27.29 |
| DCP | 109.1 | 119.3 | 126.3 |
±3.52 |
|
Feed conversion (kg feed/kg gain) |
||||
| DM | 18.24 | 17.55 | 12.97 | ±1.38 |
| TDN | 10.78 | 10.34 | 8.69 | ±0.76 |
| DCP | 1.38 | 1.43 | 1.12 |
±0.10 |
Means with different letters in the same row are significantly different at P<0.05.
was observed for feed conversion as kg TDN intake or kg DCP intake / kg gain.
Economic Evaluation for the Experimental Groups
Table 5 shows the feeding costs and profit above feeding costs. Substitution MOSM in goats’ rations caused markedly decreased feed conversion and average feed cost in goats (12.97 & 2.75 head/day, L.E.) fed 50% MOSM and 17.55 & 2.85 head/day, L.E. in goats fed 25% MOSM compared to control goats fed CSM (18.24 & 2.90 head/day, L.E.), respectively. Meanwhile, average daily gain, daily profit above feeding cost and relative economic efficiency for G2 and G3 were improved than the control (G1). Relative economic efficiency improved by 153.81% and 485.50% for G2 and G3, respectively when assuming that relative economic efficiency of control diet equals 100%.
Table 5: Effect of substitution of Moringa oleifera seed meal in rations on economic efficiency of feeding goats.
| Item | Experimental rations | ||
|
R1 |
R2 |
R3 |
|
| Total DM intake (g) | 1443.75 | 1462.50 | 1458.75 |
|
Average daily gain (g/head/day) |
79.17 | 83.33 | 112.50 |
| Feed conversion | 18.24 | 17.55 | 12.97 |
|
Average feed cost (head/day, L.E.*)1 |
2.90 | 2.85 | 2.75 |
|
Average revenue of daily gain (head/day) L.E.*) |
3.33 | 3.50 | 4.73 |
|
Net feed revenue (L.E./head)2 |
0.43 | 0.65 | 1.98 |
|
Economic feed efficiency (%)3 |
14.83 | 22.81 | 72.00 |
|
Relative economic efficiency (%)4 |
100 | 153.81 |
485.50 |
*L.E. Egyptian pound = 0.1285 $ approximately.
Market price of the 1 kg live body weight in 2015 was 42 L.E.
1 Calculated according to the local price at 2015 ( 1700, 2800, 2000, 1600, 900, 1000, 500 and 100 L.E. for ground corn, undecoraticated cotton seed meal, moringa seed meal, wheat bran, bean straw, lime stone, salt and cost of manufacturing 1 ton feed.2 Revenue of daily gain – daily feed cost.3Net feed revenue / daily feed cost x 100. 4Economic efficiency for treatment / economic efficiency for control, as assuming that relative economical efficiency of the control group equal 100.
Hematological Findings
The mean values of hemogram for different treated groups of goats before treatment (zero time) and after treatment are illustrated in Figures 1 and 2.
At zero time, mean values of RBCs, HCT, Hb, MCV, MCHC and MCH of the experimental male goats ranged from 15.23±0.54 ×10⁶ to 15.71±0.28 ×10⁶/µl; 25.12±0.35 to 25.34±0.26 %; 8.33±0.21 to 8.55±0.10 g/dl; 16.11±0.16 to 16.70±0.48 fl; 33.150.58 to 33.81±0.39 g/dl and 5.42±0.17 to 5.57±0.09 pg respectively (Figure 1).
During the period of treatment, there was an increase in RBCs count and decrease in HCT, MCV and MCH in goats fed 50% of MOSM (G3) which significant at the 6th week compared to both groups; normal group (G1) and goats fed 25% of MOSM (G2). While in the 8th week, the values of HCT, Hb and MCHC were marked (P<0.05) decreased in the group fed 25% MOSM (G2) compared to G1 and G3 (Figure 1).
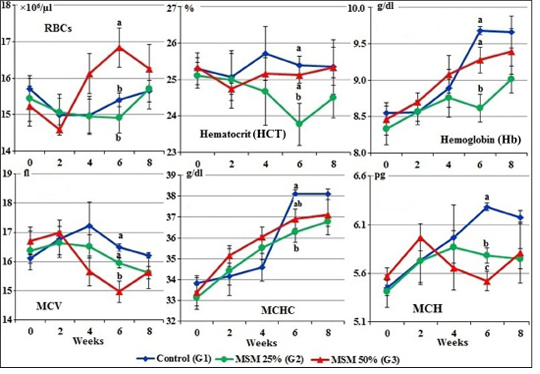
Figure 1: Erythrogram of male goats fed different levels of Moringa oleifera seeds meal in diet during 8 weeks of treatment (Mean ± SE, N=5). Means with different letters in the same period are significantly different at P<0.05.
At zero time, the total WBCs, lymphocytes, neutrophils, monocytes and eosinophils of the experimental goats (×103/µl) ranged from 11.00±0.80 to 11.18±0.82; (5.07±0.27 to 5.20±0.41; 4.87±0.37 to 4.96±0.28; 0.55±0.07 to 0.680.05 and 0.39±0.05 to 0.43±0.02, respectively (Figure 2).
During the periods of the experiment, total WBC count, lymphocytes and monocytes were markedly (P<0.05) increased while neutrophils were decreased in the G3 fed 50% MOSM compared to the other treated groups (G1 and G2). However, the values of eosinophils was markedly (P<0.05) increased in both treated groups (G2 and G3) in comparison with the control group (G1) during the periods of feeding (Figure 2).
Biochemical Findings
The mean values of serum biochemical parameters for different treated groups of goats before treatment (zero time) and after treatment are shown in Figures 3 and 4.
At zero time, the mean normal levels of serum total proteins, albumin, globulins, albumin/globulin ratio, urea and creatinine of the experimental goats ranged from 6.65±0.06 to 6.69±0.02 g/dl; 3.58±0.02 to 3.65±0.05 g/dl; 3.04±0.05 to 3.11±0.03g/dl; 1.15±0.01 to 1.21±0.04; 29.82±1.55 to 30.93±1.90 mg/dl and 0.55±1.20 to 0.69±0.08 mg/dl, respectively.
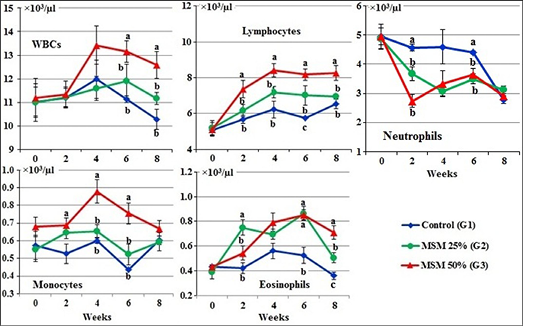
Figure 2: Leukogram of male goats fed different levels of Moringa oleifera seeds meal in ration during 8 weeks of treatment (Mean ± SE, N=5). Means with different letters in the same period are significantly different at P<0.05.
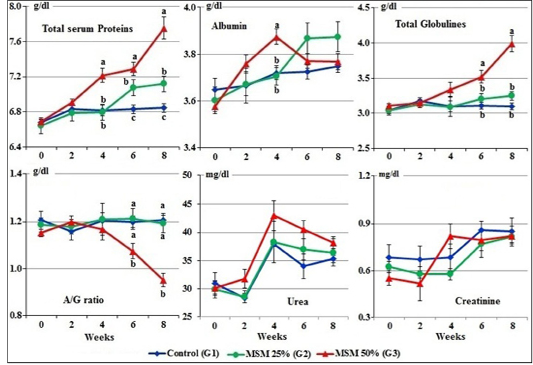
Figure 3: Serum proteins profile, urea, and creatinine concentrations of male goats fed different levels of Moringa oleifera seeds meal in ration during 8 weeks of treatment (Mean ± SE, N=5). Means with different letters in the same period are significantly different at P<0.05.
The changes in total serum proteins appeared from the 4th week to the end of the experiment, which showing significant (P<0.05) increase in group of goats fed 50% MOSM (G3) compared to G2 fed MOSM 25% (R2) and G1 fed CSM (R1). At the 6th and the 8th week of treatment, the values of total serum globulins were markedly (P<0.01) increased and A/G ratio were markedly (P<0.01) decreased in group fed 50% MOSM (G3) compared to both other groups. No statistical difference was noticed on serum albumin between all groups during the period of the treatment except at the 4th week, the serum albumin was markedly increased in group of goats fed 50% MOSM (G3) compared to both other groups. On the other hand, there was no statistical difference (P>0.05) in the serum urea and creatinine levels between all groups during the periods of treatment (Figure 3).
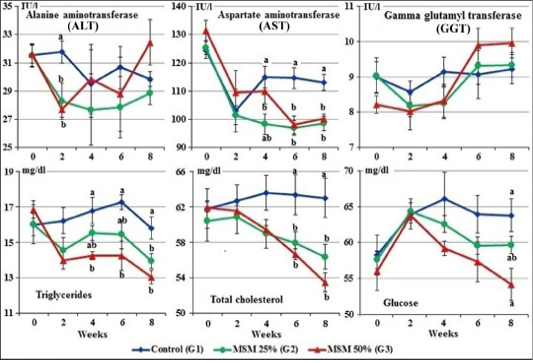
Figure 4: Serum enzymes activity, total cholesterol, triglycerides, and glucose levels of male goats fed different levels of Moringa oleifera seeds meal in ration during 8 weeks of treatment (Mean ± SE, N=5). Means with different letters in the same period are significantly different at P<0.05.
At zero time, the mean normal activity of serum ALT, AST and GGT of the experimental goats ranged from 31.51± 0.77 to 31.66±0.66 IU/l; 124.42±2.96 to 131.60±3.56 IU/l and 8.21±0.25 to 9.04±0.50 IU/l, respectively.
The results revealed that goats fed MOSM at the levels of 25% and 50% (G2&G3) showed significant decreased of the ALT and AST activities during the different periods. While, there was no significant changes in the GGT activities in G2 and G3 compared to control group (G1) (Figure 4).
At zero time, the mean normal values of triglycerides, total cholesterol and serum glucose, of the experimental goats ranged from 16.00±0.63 to 16.86±0.47 mg/dl, 60.45±2.28 to 61.97±0.54 mg/dl and 56.04±2.70 to 58.27±2.80 mg/dl, respectively.
Gradually decreases in the values of glucose, total cholesterol and triglycerides were noticed in the serum of both groups fed 25% and 50% of MOSM (G2 & G3) compared to control group (G1), which was significant (P<0.05) at the 4th, 6th and 8th week of treatment (Figure 4).
DISCUSSION
In this study, the effect of feeding 25% and 50% of (MOSM) as a potential protein source on animal performance, nutrients digestibility, feeding value, hemogram, and liver and kidney functions of male Damascus goats were evaluated.
Chemical analysis of MOSM revealed that the high content of EE which may attribute to the incomplete oil extraction from moringa seed. These results are similar with previously studies reported by Abd El-Ghani (2003), Aboul Ela et al. (2004), Abd El-Rahman (2008), Abdel-Shafy et al. (2011) and Abd El-Rahman et al. (2011), who found that the seed meals of black cumin (Nigella sativa) and Jatropha curcas have considerable amounts of CP and EE during the extraction of oil from their seeds, respectively.
In MOSM, the high percentage of essential and non-essential amino acids are double than that of the CSM. All parts of MO contain high levels of essential amino acids (Makkar and Becker, 1997). The variations in the amino acids composition are affected by the protein quality and the origin of cultivated or wild plant (Sanchez-Machado et al., 2010). Generally, the amino acids; glutamic acid, leucine, phenylalanine, lysine, aspartic acid, alanine, arginine, valine and tyrosine revealed higher level in the MOSM than in the CSM.
Feed intake revealed that the total digestible nutrient intake (TDN) and digestible crude protein (DCP) as g/kg w0.75 and g/100 kg BW, were markedly (P<0.05) higher in G2 fed R2 (25% MOSM) and G3 fed R3 (50% MOSM) than the control group (G1). But TDM and DCP in G3 markedly increased than in G2. The increasing intakes of TDN and DCP for both G2 fed R2 and G3 fed R3 may be due to increasing in all nutrients digestibility as CP, amino acids, vitamins and minerals (Abd El-Rahman, 2008; Abdel-Shafy et al., 2011; Abd El-Rahman et al., 2011).
Regarding to digestibility coefficients and nutritive value, the results showed significantly increase in digestion coefficients for animals fed R3 than both groups of animals fed R2 and R1. The improvements in all nutrients digestibility (TDN or DCP) reflected on the nutritive values. This improvement may be due to the essential amino acids and the quantity and quality of protein seed cake. This result is in agreement with those obtained by Folkard et al. (2001), who found that the protein in the cake have a high positive charge and an antibiotic effect (Makkar et al., 2007) and it has the potential to modify rumen fermentation to enhance the post ruminal protein supply. Also, the increasing in all nutrients digestibility may be due to the defatted seed cake which is free from the most secondary metabolites, produced by plant such as tannins, saponins, alkaloids, inhibitors of trypsin and amylase, lectin and cyanogenic glucosides, but contains glucosinolates (Makkar and Becker, 1997).
The present study revealed that an improvement in growth rate in goats fed R3 compared with the other groups. This result may be due to the essential amino acids represented of MOSM (25.20 g/100 g sample) is double that of the CSM (13.37 g/100 g sample) along with increasing nutrients digestibility with increasing MOSM level in ration.
The average daily gain for goats fed R3 was 112.50 g/d, followed by goats received R2 and R1, which were 83.33 and 79.17 g/d, respectively. This result might be attributed to the high TDN and DCP intake. These results are similar with those recorded by Abd El-Rahman (2008) who found that animals fed black cumin seed meal as a source of protein recorded the highest final body weight compared with other rations. The animals fed R1 containing CSM showed lower average body weight than other rations. This result may be due to lower TDN and DCP intakes compared with other groups. Moreover, CSM protein is affected by the presence of gossypol bonds (Soliman, 2002). In agreement with results obtained in the present study, Khan et al.(1996) using diets containing CSM and Canola meal, who found that CSM had less effectiveness for growing animals than Canola meal.
The R3 has the best feed conversion value (12.97, 8.69, and 1.12 as kg DM, kg TDN and kg DCP intakes/kg gain, respectively) in comparison with R2 and R1 (17.55, 10.34, 1.43 and 18.24, 10.78, 1.38 as kg DM, kg TDN and kg DCP intakes/kg gain, respectively). These results were in agreement with Abd El-Ghani (2003) and Abd El-Rahman (2008) who found that the diets containing black cumin seed meal as a good new source of protein recorded the best feed conversion.
Based upon the difference in both growth rate and feeding cost per animal, total feed cost was decreased for R3 and R2 (2.75 and 2.85 L.E. / head, respectively) compared with R1 (2.90 L.E. /head). This reduction was due to the lower price of moringa seed meal (2000 L.E./ton) compared with 2800 L.E./ton for cotton seed meal. On the other hand, the results showed that total revenue, economic efficiency and relative economic efficiency were the best with R3 (50% MSM) followed by R2 and R1. The same results were obtained by Abd El-Rahman et al. (2011) with goats fed different levels of jatropha seed meal as a new source of protein. From the economical evaluation of this study, the 25 and 50% of MOSM replacement in rations could be recommended.
Hemogram and serum biochemical parameters reflect the metabolic status of the organs and tissues when feeding unconventional feed sources (Thrall et al., 2004). In this study, all of the hemogram and biochemical parameters were within the normal range at zero time as reported by Weiss and Wardrop (2010) and Kaneko et al. (2008). After 4th week of this experimental period, there was an increase in the values of RBC count and decreases in MCV and MCH in goats fed of MOSM 50% (G3) which significant at the 6th week compared to normal group (G1) and goats fed MOSM 25% (G2). While the values of HCT, Hb and MCHC were markedly decreased in the G2 fed MOSM 25% compared to G1 fed CSM 100%.
The increase in the RBCs counts of goats fed MOSM may be due to the MOSM is rich in amino acids (as methionine), vitamins (carotene and ascorbic acid) and minerals particularly iron (Makkar and Becker, 1997; Faye et al., 2011) which increased the synthesis of erythropoiesis from bone marrow (Weiss and Wardrop, 2010). However, decreases in MCV and MCH at 6th week of treatment were recorded in G3 fed R3 (MOSM 50%) may be due to high content of anti-nutritional factors such as phenolic contents, alkaloids, reducing sugars, cardiac glycosides, saponins, tannins and phytates, haemagglutinin, lecthins in the seeds. These secondary metabolites may interfere with the nutrients utilization (digestion and absorption) (Zade et al., 2013; Idoko et al., 2017).
Results revealed that total WBC count, lymphocytes, monocytes and eosinophils were markedly increased, while, neutrophils were decreased in the G3 fed 50% MOSM compared to the other treated groups (G1 and G2). It may be attributed with the high content of amino acid; as arginine -one of non-essential amino acids in moringa seed meal (R3). Arginine is known to escalate cellular immunity and boosts lymphocyte and macrophage proliferations (Ferreria et al., 2008; Annongu et al., 2013). Also, the reduction in neutrophils attributed with increases in lymphocytes (Weiss and Wardrop, 2010).
Regarding to protein profile, total serum proteins and globulins were increased in the serum of goats fed R3 (50% MOSM) compared to both groups fed R1 and R2. The increases may be due to MOSM contained high content of protein (30.04%), amino acids, minerals, vitamins and potent antioxidant compounds; which decreases protein oxidation (Achuba et al., 2016; Mohammed et al., 2017).
Regarding to the serum liver enzymes, goats fed MOSM at the levels of 25 and 50% (G2&G3) showed significant decreased of the ALT and AST activities during the different periods. This effect could be attributed to its content of vitamins, carotenoids and phytocompounds; polyphenols, phenolic acids, flavonoids, alkaloids, glucosinolates, isothiocyanates, tannins and saponins which have been proved to have potent antioxidant properties and other biological activities (Zade et al., 2013; Idoko et al., 2017; El-Hak et al., 2018; Atta et al., 2019).
Gradually decreases in the values of glucose, total cholesterol and triglycerides were noticed in the serum of both groups fed 25 and 50% MOSM (G2 & G3) compared to control group (G1). The hypoglycemic and hypolipidaemic activity of several medicinal plants has been associated to bioactive agents like alkaloids, tannins and cardiac glycosides. Alkaloids may mediate hypolipidaemic action either by up regulation of activities of lipolytic enzymes or by stimulating faecal bile acid excretion (Patil et al., 2010; Emmanuel, 2016). Also, other phytoconstituents such as β-sitosterol could be the major cholesterol reducing components of Moringa oleifera leaf ethanol extract as it may work singly or in synergy with other bioactive agents (Pop et al., 2018), which may be the cause improvement of lipid profile in this study. Similar results are recorded in rats administered different levels of dry seed of M. peregrina by El-Hak et al. (2018).
There were no significant changes in serum urea and creatinine levels between all groups during the periods of treatment. This indicated that MOSM non-toxic due to contained phytochemical compounds which have protective effect on liver and kidneys.
CONCLUSION
This study suggested that 25% and 50% of Moringa oleifera seed meal (MOSM) could be used as a potential protein source instead of protein of cotton seed meal to feeding the goats. Additionally, MOSM is beneficial to improve the cellular immunity, liver and kidney functions. Moreover, from the economical evaluation of this study, 50% of MOSM replacement in rations could be recommended to improve the relative economic efficiency in goat farming.
ACKNOWLEDGEMENTS
The authors acknowledge financial support from Science and Technology Development Fund (STDF), Academy of Science Research of the Ministry of Scientific Research (ID: 5979).
CONFLICT OF INTEREST
No potential conflict of interest was reported by the authors.
AUTHORS CONTRIBUTION
All authors shared equally in designing, conducting the experiments and writing the manuscript.
REFERENCES


