Journal of Animal Health and Production
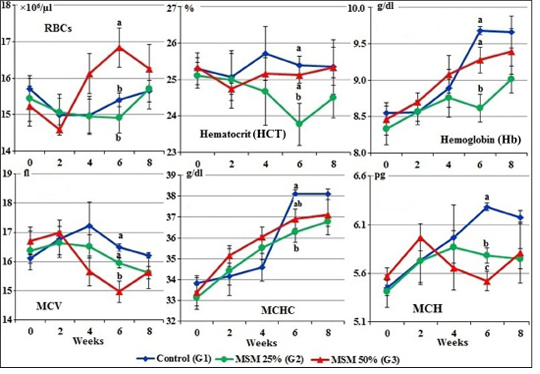
Erythrogram of male goats fed different levels of Moringa oleifera seeds meal in diet during 8 weeks of treatment (Mean ± SE, N=5). Means with different letters in the same period are significantly different at P<0.05.
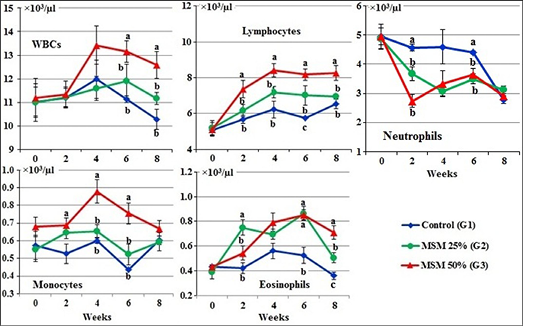
Leukogram of male goats fed different levels of Moringa oleifera seeds meal in ration during 8 weeks of treatment (Mean ± SE, N=5). Means with different letters in the same period are significantly different at P<0.05.
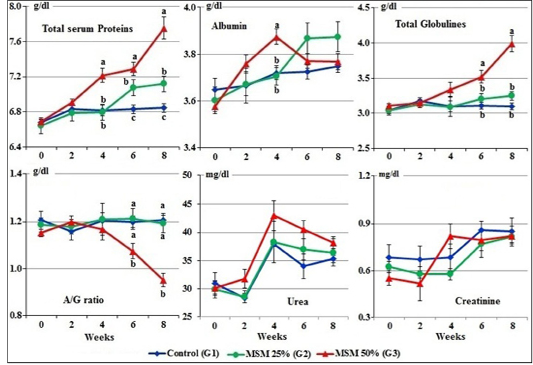
Serum proteins profile, urea, and creatinine concentrations of male goats fed different levels of Moringa oleifera seeds meal in ration during 8 weeks of treatment (Mean ± SE, N=5). Means with different letters in the same period are significantly different at P<0.05.
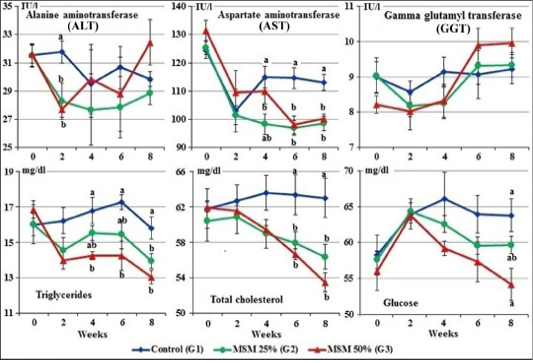
Serum enzymes activity, total cholesterol, triglycerides, and glucose levels of male goats fed different levels of Moringa oleifera seeds meal in ration during 8 weeks of treatment (Mean ± SE, N=5). Means with different letters in the same period are significantly different at P<0.05.


