Journal of Animal Health and Production
Research Article

Effect of Quinolones on Blood Glucose Level and Blood Profile of Laying Hens
Asif ur Rehman1, Arsalan Khan2*, Sarzamin Khan1, Hamza Maris3, Naseer Khan4
1Department of Poultry Science, Faculty of Animal Husbandry and Veterinary Sciences, Agriculture University Peshawar, 25000, Pakistan; 2Livestock Research and Development Station, Paharpur, Dera Ismail Khan-29050-Pakistan; 3Department of Poultry and Animal Sciences, Faculty of Veterinary and Animal Sciences, Gomal University, Dera Ismail Khan-29050-Pakistan; 4Livestock and Dairy Development Department (Extension), Khyber Pakhtunkhwa Peshawar-25000-Pakistan
Abstract | A study was designed to investigate the effects of quinolones antibiotics on the blood profile, blood glucose level, histomorphological features of pancreas and egg production of laying hens. For this purpose, a total of 48 laying hens were selected and allocated into four groups, each group included three replicates containing four birds in each. Three commonly used quinolones including enrofloxacin, ciprofloxacin and norfloxacin were used for four weeks with one week of adaptation period, while, one group served as negative control. Blood was collected directly from wing vein and serum was analyzed for estimation of blood proteins, glucose level, cholesterol and albumin which showed non-significant (P>0.05) response to quinolones treatment. Highest blood glucose level was measured for control (239.21 ± 5.26), followed by groups treated with enrofloxacin (233.54± 4.19), ciprofloxacin (227.76 ±4.71) and lowest in norfloxacin (225.47 ± 4.85). Highest cholesterol level was measured in groups administered with norfloxacin (164.17± 3.55), followed by control (163.36±1.99), ciprofloxacin (161.53±3.14) and enrofloxacin (160.78± 3.18). The highest level of total protein in blood was recorded in control group (18.51±0.18), followed by enrofloxacin (18.43± 0.27), norfloxacin (18.28± 0.10) and lowest in ciprofloxacin treated group (18.12± 0.36). The highest level of albumin in blood was found in control group (2.82±0.19), followed by enrofloxacin (2.70±0.15), ciprofloxacin (2.61±0.06) and norfloxacin (2.54±0.12). The highest count of WBCs (white blood cells) in blood was recorded for group treated with ciprofloxacin (18.6 ± 10.63), followed by norfloxacin (17.6± 3.63) and control group (17.1± 10.63), while, lowest in enrofloxacin treated group (16.9± 2.53). Total RBCs (red blood cells) and average hemoglobin values showed non-significant (P>0.05) changes in blood profile of laying hens in the treated groups. Hens egg production showed significant (P<0.05) increase in groups treated with different quinolones i.e., 10.95% was in norfloxacin, which was higher than control group followed by group treated with ciprofloxacin (8.63%) and enrofloxacin (6.5%). Histomorphology of pancreas treated with quinolones were noted and findings revealed that quinolones did not affect the histological architecture of the pancreas. It was thus concluded that quinolones have non-significant effect (P>0.05) on the serum biochemistry, blood profile and histomorphology of laying hens.
Keywords | Enrofloxacin, Ciprofloxacin, Norfloxacin, Histomorphology, Laying hens
Editor | Asghar Ali Kamboh, Sindh Agriculture University, Tandojam, Pakistan.
Received | February 22, 2019; Accepted | March 25, 2019; Published | April 19, 2019
*Correspondence | Arsalan Khan, Livestock Research and Development Station, Paharpur, Dera Ismail Khan-29050-Pakistan; Email: drarsalankhandvm@gmail.com
Citation | Rehman A, Khan A, Khan S, Maris H, Khan N (2019). Effect of quinolones on blood glucose level and blood profile of laying hens. J. Anim. Health Prod. 7(2): 51-57.
DOI | http://dx.doi.org/10.17582/journal.jahp/2019/7.2.51.57
ISSN | 2308-2801
Copyright © 2019 Rehman et al. This is an open access article distributed under the Creative Commons Attribution License, which permits unrestricted use, distribution, and reproduction in any medium, provided the original work is properly cited.
INTRODUCTION
Poultry industry plays a vital role in the world economic cycle and is the second largest enterprise of Pakistan. Almost 1.5 million people are earning their subsistence from poultry industry. Currently total investment in this sector has reached up to Rs. 200 billion with growth rate of 8-10 percent. Shares of poultry industry in national GDP are 1.3 percent (Economic survey of Pakistan 2015-2016).
In modern poultry production system antimicrobial agents are being increasingly used to enhance feed efficiency, improve productivity, promote health and for disease prophylaxis and treatment (Johnston, 1998; Prescott et al., 2000). It is important to note that the quinolones are synthetic anti-microbial agents used broadly in the poultry field for the control of untimely mortality and for the prevention and treatment of respiratory, uro-genital and digestive tract infections (Martinez et al., 2006). Antibiotics usage has also enhanced the health and well-being of poultry by reducing the incidence of diseases (Resurreccion and Galvez, 1999).
Various forms of quinolones available in Pakistan including ciprofloxacin, norfloxacin and enrofloxacin etc are extensively used in poultry sector to overcome the infectious bacterial maladies (Anjum and Rizvi, 1998). For the control of early chick mortality, for prophylaxis and treatment of respiratory, renal and digestive infections, enrofloxacin has undergone growth in poultry enterprises. These quinolones are thought to be relatively safer antibiotics and are well tolerated in poultry (Kordick et al., 1997; Todorov 2010).
The objectives of the current study were to investigate the effects of quinolones antibiotics on the blood profile, blood glucose level, histomorphological features of pancreas and egg production of laying hens.
MATERIAL AND METHODS
The study was conducted at the Department of Poultry Science, Agriculture University Peshawar, following the guidelines of animal ethics principles. For this purpose, a total of 48 laying hens (layers of age more than 60 weeks, weighing 3.5-5 pounds) were selected and separated into 4 groups, each group included three replicates containing four birds in each. Three commonly used quinolones including enrofloxacin, ciprofloxacin and norfloxacin at the dose rate of 0.25mg/liter of drinking water were used, while, one group served as negative control (Table 1).
Birds were caged under identical environmental conditions. Commercial feed and water were offered at ad-libitum. The study was continued for four weeks including one week as adaptation period.
Eggs were collected on day-to-day basis from all groups to work out for daily eggs production. Blood samples were collected from the wing vein on weekly basis, for biochemical analysis and blood profile including hemoglobin, packed cell volume, RBCs count, WBCs count and blood glucose level by hematology analyzer. For histomorphology of pancreas, tissues were collected from experimental groups and were dried by immersing through a chain of alcohol of increasing concentrations (i.e., from 30% to absolute), cleared with xylene and filtered tissues were embedded in paraffin, Thin slices of sized 3-5µm were obtained by rotary microtome. The egg albumin was used to pursue the sections on the glass slide and dried for one hour in the oven at 60oC. The Harris haematoxylin and eosin (H&E), staining techniques were applied to stain the sections of the various tissues. The sections were reimbursed in the xylene and before putting a cover slip on the stained sections, a drop of distyrene plasticizer xylene (DPX), (Sigma Aldrich) was applied and studied under light microscope at suitable magnification and results were recorded.
The data obtained was analyzed using analysis of variance (ANOVA) and complete randomized design of statistical analysis system (Statistics 8.1).
RESULTS
Effect of Quinolones on Mean Blood Glucose Level (Mg/Dl) of Laying Hens
The effect of quinolones on blood glucose level of laying hens was found non-significant (P>0.05). Highest blood glucose level was measured for control group (239.21±5.26), followed by enrofloxacin (233.54± 4.19), ciprofloxacin (227.76 ±4.71) and lowest for group administered with norfloxacin (225.47 ± 4.85) as shown in Table 2.
Effect of Quinolones on Mean Cholesterol Level (Mg/Dl) of Laying Hens
The effect of quinolones on cholesterol level was found non-significant (P>0.05) as mentioned in Table 3. Highest cholesterol level was measured for norfloxacin (164.17± 3.55) followed by control group (163.36±1.99), ciprofloxacin (161.53±3.14), while the lowest cholesterol level was measured for enrofloxacin (160.78± 3.18).
Effect of Quinolones on Mean Blood Protein (G/Dl) of Laying Hens
Quinolones had non-significant (P>0.05) effect on the blood proteins level of laying hens (Table 4). The highest level of total protein in blood was measured for control group (18.51±0.18), followed by enrofloxacin (18.43± 0.27), norfloxacin (18.28± 0.10) and ciprofloxacin treated group (18.12± 0.36).
Effect of Quinolones on Mean Albumin (G/Dl) of Laying Hens
Effect of quinolones on blood Albumin in laying hens is shown in Table 5, showing non-significant (P>0.05) changes in the blood albumin of laying hens treated with quinolones antibiotics. The highest level of albumin in blood was found for control group (2.82±0.19), then,
Table 1: Experimental layout for the birds
| Group |
Dose of Administration |
Replicates |
Total
|
||
| R1 | R2 | R3 | |||
| Control | --------------- | 04 | 04 | 04 | 12 |
| Enro | 0.25 mg/L | 04 | 04 | 04 | 12 |
| Cipro | 0.25 mg/L | 04 | 04 | 04 | 12 |
| Nor | 0.25 mg/L | 04 | 04 | 04 |
12 |
Enro: Enrofloxacin Cipro: Ciprofloxacin Nor: Norfloxacin
Table 2: Effect of quinolones on mean blood glucose level (mg/dl) of laying hens
| Group |
Week 1st (Mean ± SE) |
Week 2nd (Mean ± SE ) |
Week 3rd (Mean ± SE ) |
Week 4th (Mean ± SE ) |
Over All (Mean ± SE ) |
| Control | 232.10 ± 6.02 | 230.30 ± 5.80 | 245.00 ±3.40 | 249.53± 6.08 | 239.21±5.26 |
| Enro | 225.80 ± 5.62 | 224.60 ± 5.88 | 242.70± 6.48 | 241.07 ± 4.56 | 233.54± 4.19 |
| Cipro | 221.40 ±5.96 | 211.33 ± 6.61 | 231.77 ± 6.15 | 246.93 ± 4.21 | 227.76 ±4.71 |
| Nor | 209.83 ± 8.05 | 219.73 ± 5.72 | 242.33 ± 4.20 | 229.97± 6.53 | 225.47± 4.85 |
| P-value | 0.180 | 0.228 | 0.3459 | 0.128 |
0.250 |
Enro: Enrofloxacin Cipro: Ciprofloxacin Nor: Norfloxacin
Table 3: Effect of quinolones on mean cholesterol level (mg/dl) of laying hens
| Group |
Week 1st (Mean ± SE) |
Week 2nd (Mean ± SE ) |
Week 3rd (Mean ± SE ) |
Week 4th (Mean ± SE ) |
Over All (Mean ± SE ) |
| Control | 169.83± 2.94 | 163.83±2.88 | 165.83± 3.76 | 153.93± 5.00 | 163.36±1.99 |
| Enro | 167.17± 4.04 | 164.87± 3.60 | 159.03 ±1.53 | 152.07± 4.82 | 160.78± 3.18 |
| Cipro | 164± 4.769 | 165.50± 5.00 | 167.13 ±1.43 | 149.50± 4.19 | 161.53±3.14 |
| Nor | 161.63± 3.62 | 175± 4.04 | 165.03± 5.95 | 155± 7.88 | 164.17 ± 3.55 |
| P- value | 0.506 | 0.241 | 0.459 | 0.906 |
0.846 |
Enro: Enrofloxacin Cipro: Ciprofloxacin Nor: Norfloxacin
Table 4: Effect of quinolones on mean blood protein (g/dl) of laying hens
| Group |
Week 1st (Mean ± SE) |
Week 2nd (Mean ± SE ) |
Week 3rd (Mean ± SE ) |
Week 4th (Mean ± SE ) |
Over All (Mean ± SE ) |
| Control | 18.71± 0.43 | 18.43± 0.34 | 18.12± 052 | 18.77± 0.28 | 18.51±0.18 |
| Enro | 19.31 ± 0.65 | 18.27± 0.37 | 17.68± 0.40 | 18.82± 0.34 | 18.43± 0.27 |
| Cipro | 17.33± 0.37 | 18.59± 0.49 | 18.28± 0.38 | 17.95± 0.29 | 18.12± 0.36 |
| Nor | 17.89± 0.23 | 17.55± 0.18 | 19.08± 0.31 | 18.33± 0.22 | 18.28± 0.10 |
| P- value | 0.1248 | 0.6966 | 0.1552 | 0.1940 |
0.6450 |
Enro: Enrofloxacin Cipro: Ciprofloxacin Nor: Norfloxacin
Table 5: Effect of quinolones on mean albumin (g/dl) of laying hens
| Group |
Week 1st (Mean ± SE) |
Week 2nd (Mean ± SE ) |
Week 3rd (Mean ± SE ) |
Week 4th (Mean ± SE ) |
Over All (Mean ± SE ) |
| Control | 2.43±0.12 | 2.90±0.25 | 3.23±0.63 | 2.52±0.21 | 2.82±0.19 |
| Enro | 2.73±0.23 | 2.86±0.37 | 2.54±0.17 | 2.66±0.18 | 2.70±0.15 |
| Cipro | 2.68±0.05 | 3.00±0.05 | 2.41±0.20 | 2.34±0.08 | 2.61±0.06 |
| Nor | 2.46 ±0.08 | 2.55±0.34 | 2.60±0.20 | 2.67±0.28 | 2.54±0.12 |
| P- value | 0.368 | 0.741 | 0.437 | 0.918 |
0.790 |
Enro: Enrofloxacin Cipro: Ciprofloxacin Nor: Norfloxacin
Table 6: Effect of quinolones on mean WBCs count (x 103/mm3) of laying hens
| Group |
Week 1st (Mean ± SE) |
Week 2nd (Mean ± SE ) |
Week 3rd (Mean ± SE ) |
Week 4th (Mean ± SE ) |
Over All (Mean ± SE ) |
| Control | 18.1± 1.73 | 16.5± 13.22 | 17.2± 44.2 | 16.3± 44.06 | 17.1± 10.63 |
| Enro | 18.3± 1.16 | 17.2± 23.09 | 15.6± 31.79 | 17.5± 20.0 | 16.9± 2.53 |
| Cipro | 20.6± 1.45 | 15.3± 17.63 | 16.6± 14.53 | 22.0± 30.55 | 18.6± 10.63 |
| Nor | 18.7± 2.08 | 17.6± 20.81 | 18.2 ± 21.85 | 17.3± 21.85 | 17.6± 3.63 |
| P- value | 0.614 | 0.913 | 0.755 | 0.260 |
0.366 |
Enro: Enrofloxacin Cipro: Ciprofloxacin Nor: Norfloxacin
Table 7: Effect of quinolones on mean PCV (%) of laying hens
| Group |
Week 1 (Mean ± SE) |
Week 2 (Mean ± SE) |
Week 3 (Mean ± SE) |
Week 4 (Mean ± SE) |
Over All (Mean ± SE) |
| Control | 39.36 ± 0.98 | 40.56 ± 0.38 | 39.26 ± 1.10 | 39.50 ± 0.28 | 39.67 ± 0.26 |
| Enro | 37.16 ± 1.64 | 37.30 ± 1.35 | 41.50 ± 1.65 | 41.27 ± 1.97 | 39.30 ± 1.23 |
| Cipro | 35.53 ± 1.77 | 38.96 ± 1.81 | 41.10 ± 1.54 | 40.66 ± 1.30 | 39.04 ± 1.57 |
| Nor | 39.73 ± 0.89 | 40.40 ± 0.46 | 40.33 ± 1.24 | 41.18 ± 0.37 | 40.40 ± 0.10 |
| P- value | 0.171 | 0.286 | 0.717 | 0.706 |
0.828 |
Enro: Enrofloxacin Cipro: Ciprofloxacin Nor: Norfloxacin
Table 8: Effect of quinolones on mean total red blood cells count (x 106/mm3) of laying hens
| Group |
Week 1 (Mean ± SE) |
Week 2 (Mean ± SE) |
Week 3 (Mean ± SE) |
Week 4 (Mean ± SE) |
Over All (Mean ± SE) |
| Control | 4.20 ± 0.05 | 3.86 ± 0.20 | 3.93 ± 0.12 | 4.16 ± 0.17 | 4.04 ± 0.03 |
| Enro | 3.96 ± 0.31 | 4.63 ± 0.27 | 4.49 ± 0.21 | 4.22 ± 0.23 | 4.42 ± 0.10 |
| Cipro | 3.66 ± 0.14 | 4.59 ± 0.32 | 4.32 ± 0.13 | 4.60 ± 0.30 | 4.30 ± 0.12 |
| Nor | 3.59 ± 0.37 | 4.10 ± 0.15 | 4.36 ± 0.24 | 4.49± 0.23 | 4.13 ± 0.18 |
| P- value | 0.349 | 0.147 | 0.290 | 0.580 |
0.239 |
Enro: Enrofloxacin Cipro: Ciprofloxacin Nor: Norfloxacin
Table 9: Effect of quinolones on mean hemoglobin (g/100ml) of laying hen
| Group |
Week 1st (Mean ± SE) |
Week 2nd (Mean ± SE ) |
Week 3rd (Mean ± SE ) |
Week 4th (Mean ± SE ) |
Over All (Mean ± SE ) |
| Control | 11.80 ± 0.80 | 10.36 ± 0.34 | 11.20 ± 1.13 | 11.32 ± 0.60 | 11.20 ± 0.31 |
| Enro | 11.23 ± 0.50 | 10.53 ± 0.46 | 10.90 ± 0.62 | 11.06 ± 0.56 | 10.90 ± 0.41 |
| Cipro | 9.86 ± 0.34 | 10.40 ± 0.76 | 11.86 ± 0.20 | 11.71± 1.03 |
11.11 ± 0.32 |
| Nor | 10.53 ± 0.48 | 10.73 ± 0.60 | 11.26 ± 0.53 | 11.46 ± 0.56 | 11.09 ± 0.18 |
| P- value | 0.161 | 0.972 | 0.378 | 0.940 |
0.846 |
Enro: Enrofloxacin Cipro: Ciprofloxacin Nor: Norfloxacin
Table 10: Effect of quinolones on mean egg production of laying hens
| Group |
Week 1st (Mean ± SE) |
Week 2nd (Mean ± SE) |
Week 3rd (Mean ± SE) |
Week 4th (Mean ± SE) |
Average (Mean ± SE) |
| Control | 70.23 ±1.19 |
69.04b ±3.15 |
72.64b ±3.18 |
76.18b ±3.15 |
72.02b ±2.60 |
| Enro | 72.61 ±3.26 |
76.18ab ±3.34 |
80.95ab ±3.14 |
84.52ab ±3.34 |
78.57ab ±2.06 |
| Cipro | 72.55 ±3.15 |
78.57a ±2.06 |
84.52a ±3.22 |
86.90a ±3.15 |
80.65a ±2.64 |
| Nor | 71.42 ±2.06 |
84.28a ±1.09 |
86.90a ±1.19 |
89.28a ±2.07 |
82.97a ±0.56 |
| P- value | 0.0143 | 0.0168 | 0.0312 | 0.0475 |
0.0332 |
Enro: Enrofloxacin Cipro: Ciprofloxacin Nor: Norfloxacin
group treated with enrofloxacin (2.70±0.15), ciprofloxacin (2.61±0.06) and norfloxacin (2.54±0.12).
Effect of Quinolones on Mean Wbcs Count (X 103/Mm3) of Laying Hens
Effect of quinolones on mean WBCs count (white blood cells) shown in Table 6, revealed non-significant (P>0.05) effect on WBCs count of laying hens treated with quinolones in drinking water. The highest level of WBCs count in blood was found in group treated with ciprofloxacin (18.6 ± 10.63), norfloxacin (17.6± 3.63), control group (17.1± 10.63) and enrofloxacin (16.9± 2.53).
Effect of Quinolones on Mean Pcv (%) of Laying Hens
Results revealed (Table 7) non-significant effects (P>0.05) on packed cell volume in the blood of laying hens treated with quinolones in drinking water. Numerically highest PCV level was observed for norfloxacin (40.04 ± 0.10), followed by control group (39.67 ± 0.26), enrofloxacin (39.30 ± 1.23), while the lowest PCV level was measured (39.04 ± 1.57) for ciprofloxacin treated group.
Effect of Quinolones on Mean Total Red Blood Cells Count (X 106/Mm3) of Laying Hens
Effect of quinolones on total red blood cells count is given in Table 8. There is non-significant (P>0.05) changes in the TRBC count in blood of laying hens treated with quinolones in drinking water. The highest level of TRBC was measured in enrofloxacin (4.42 ± 0.10) treated group, followed by ciprofloxacin (4.30 ± 0.12), norfloxacin (4.13 ± 0.18), while, the lowest RBCs count was observed for control group (4.04 ± 0.03).
Effect of Quinolones on Mean Hemoglobin (G/100Ml) Of Laying Hens
Effect of quinolones on hemoglobin in laying hens (Table 9) showed non-significant (P>0.05) effect on Hb of blood of laying hens treated with quinolones in drinking water. The highest level of Hb in the blood was for control group (11.20 ± 0.31), followed by ciprofloxacin (11.11 ± 0.32), norfloxacin (11.09 ± 0.18) and lowest for enrofloxacin treated group (10.90 ± 0.41).
Effect of Quinolones on Mean Egg Production of Laying Hens
Effect of Quinolones in laying hens on weekly and average Hen day egg production (Table 10) revealed that quinolones significantly (P 0.05) increased the Hen day egg production of laying hens. Hens’ day egg production in group treated with norfloxacin was 10.95 %, higher than the control group, followed by ciprofloxacin (8.63%) and enrofloxacin (6.5%).
Histopathology of Pancreas
The effect of quinolones (enrofloxacin, ciprofloxacin and norfloxacin) on pancreas was recorded and the findings showed that quinolones did not affect the histological architecture of the pancreas. The findings revealed the both control and quinolones treated birds showed normal pancreas (Figure 1 & 2, respectively).
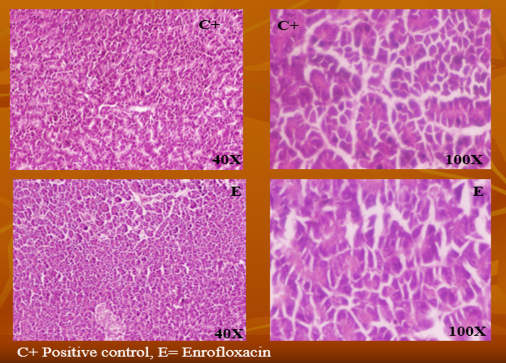
Figure 1: The pancreas of control and enrofloxacin treated birds showed normal histological detail (H & E stain).
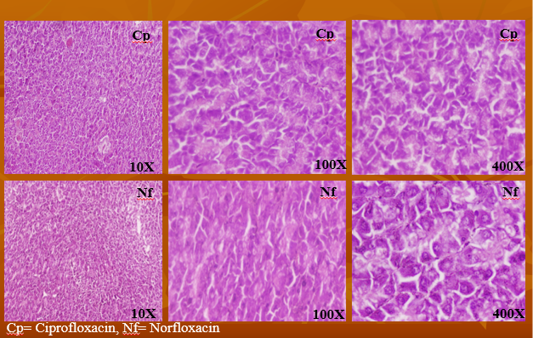
Figure 2: The pancreas in ciprofloxacin and norfloxacin treated birds showed normal histological detail (H & E stain).
DISCUSSION
No significant effect was (P>0.05) observed for blood glucose level of laying hens that were given different level of quinolones antibiotics in their drinking water. Highest blood glucose level was measured for control group. It has been found that administration of Enrotryl and Baytril at a dose level of equivalent to 10mg/kg b.w. daily for five consecutive days in laying hens induced insignificant changes in blood glucose level (Elkholy et al., 2009). Our results are in agreement with Aziz (2005), who revealed that blood glucose level had insignificant changes compared to control group. Altreuther, (1987) also revealed that there are insignificant changes in blood glucose level in laboratory animals administered with enrofloxacin. Scheer, (1987) found that the use of enrofloxacin did not cause any change in the blood sugar.
There was non-significant (P>0.05) effect on the level of cholesterol in the birds that were treated with quinolones. Our findings are in agreement with Aziz (2005), in which serum cholesterol of treated groups have insignificant changes compare to control group. It has also been found that administration of Enrotryl and Baytril at a dose level of equivalent to 10mg enrofloxacin /kg body weight, daily for five consecutive days in laying hens induced insignificant changes in blood cholesterol level (Elkholy et al., 2009).
Our results regarding blood protein level coincide with Sureshkumar et al. (2013), who suggested that use of enrofloxacin in broiler chickens at recommended doses caused insignificant changes in blood protein, albumin, lactate dehydrogenase and urea levels. The birds treated with ciprofloxacin for five days post oral administration causes insignificant changes in total blood proteins.
Our current study showed non-significant changes in the blood albumin of laying hens treated with quinolones. Sureshkumar et al. (2013) also reported that administration of commonly used quinolones at recommended dose rate causes insignificant changes in albumin and in total blood protein of broiler chickens.
Furthermore, our results on WBCs count are matching with Aziz (2005), in which non-significant changes in hematological values like WBCs, PCV, Hb and in RBCs were found. Our results closely resemble with normal ranges as mentioned earlier (Talebi et al., 2005). The effect of Enrotryl and Baytril on blood picture (WBCs, Hb, PCV and RBCs) of laying hens by oral administration of enrofloxacin at the dose rate of 10mg/kg b.w. for the period of 5 consecutive days was also found non-significant (Elkholy et al., 2009).
Our results correlate with Elkholy et al. (2009) whereby the effect of Enrotryl and Baytril on blood picture (PCV, RBCs and Hb) of laying hens by oral administration of enrofloxacin at the dose rate of 10mg/kg body weight for 5 consecutive days found non-significant changes. Our results do resemble Aziz (2005)revealing non-significant changes in the hematological values (RBCs, PCV and Hb) of treated groups as compared to control group.
Our findings on egg production are in coincidence with Kumar et al. (2009), who revealed that egg production and egg weight of laying hens was improved by addition of biocilin. While Augspurger et al. (2007) stated that interflox addition increased the egg production during the first twenty-eight days of age of the experimental time. Furthermore, Wu et al. (2006) reported significant increase in egg production with the addition of antibiotics in water at the dose level of 20-30mg/ kg body weight.
Our study revealed that both the control and quinolones treated birds showed normal histological details from which it could be concluded that quinolones are safe to use antibiotics in laying hens. It has been found that administration of quinolones in birds is safe and having no adverse effects on pancreas and other visceral organs (Lucky, 2010).
CONCLUSION
Quinolones at dose rate of 0.25mg/liter drinking water, did not affect glucose, cholesterol, total serum protein, RBCs count, WBCs count, Hb level and PCV values of blood. Moreover, quinolones treated lying hens showed normal pancreas histological structures and significantly improved egg production. These results demonstrated that quinolones at dose rate of 0.25mg/liter in drinking water are safe antibiotics in laying hens.
Acknowledgements
It is hereby acknowledged that no funds were utilized from any grant or project.
Conflict of Interest
Authors declare no conflict of interest.
Authors Contribution
This is basically the contribution of 1st and 2nd author, while other authors are helping hands.
REFERENCES


